My aunt Susanne is an elderly lady, who lives at the countryside and looks forward to celebrating her 80th birthday soon. Since the 1960's she has had a telephone connection with her fixed line provider. At that time, and for many years later, in the country where my aunt lives, you had to apply for a telephone contract and hope that you received one. This was long before topics like "customer relationship management" or "customer care" became important. There was almost no personal data (date of birth, demographics) collected during the application process, as there was need for it. The most important details were the post address of the telephone line, so the provider could send out the bill.
In the 1990's, topics like "customer segmentation" and "know your customers" became more and more important, also at aunt Susanne’s phone provider. Since then it is mandatory to provide the date of birth with every new contract or contract change. My aunt, however, never changed or extended her phone contract (She says, “A simple phone is enough!”) and newer participated in customer surveys or marketing campaigns. Thus, no additional data were collected from her. And she is not the only one in this situation. In her circle of friends there are many with a similar “data history.”
The statistician in his cubicle
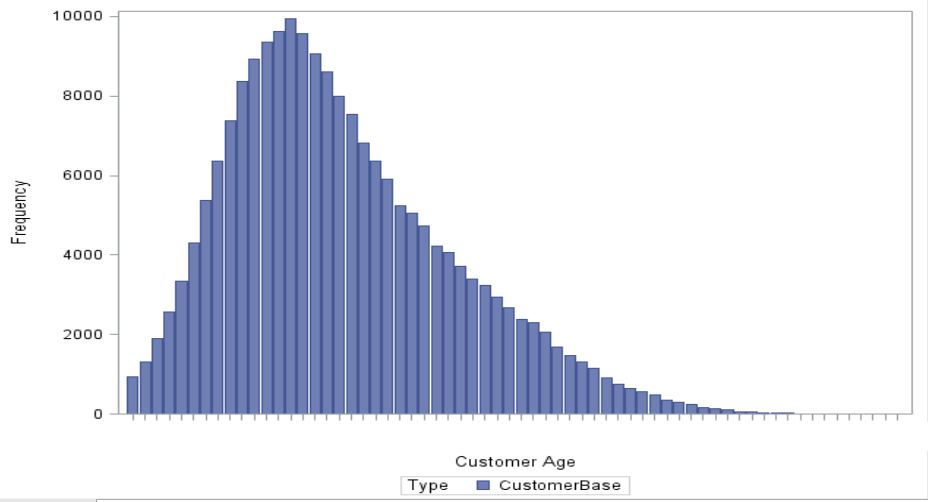
If the statistician in the analysis department of aunt Susanne’s phone provider now looks into the customer database and creates an analysis of "customer age," he might see the following picture.

The age distribution by years shows how many customers are in which customer age groups. Based on that information, it is possible to define priorities for product bundles and selections for marketing campaigns. Additionally, in this diagram, the statistician will see the proportion of missing values, where customer age could not be calculated because of a missing date of birth. In our case this proportion is 9.1 percent.
The statistician now must decide how to deal with the missing values.
- Shall a group with "age unknown" be created?
- Shall the observations with missing values just be excluded from the analysis?
- Shall an average age of 42 years be assumed?
- Or shall the imputation values be sampled from the true distribution.
The last two options assume implicitly that there is no pattern behind the fact that age is missing.
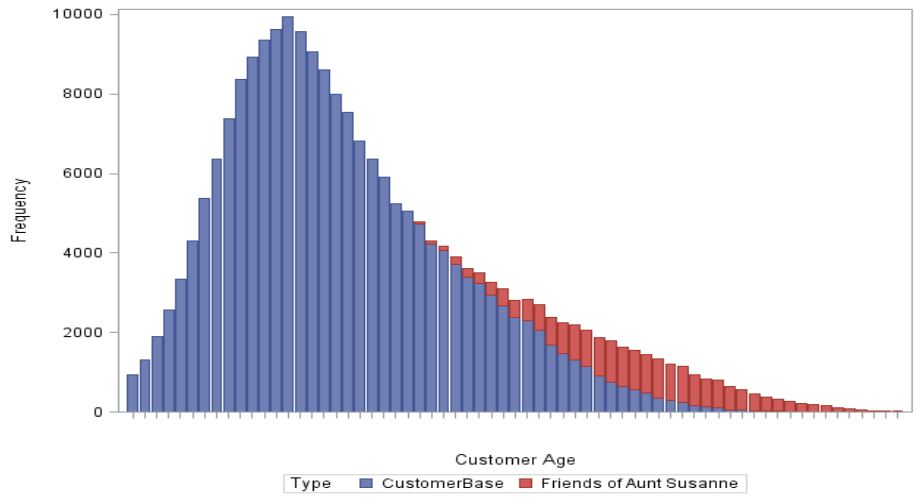
If we, however, now return to my aunt Susanne and her friends, we can assume that the missing values occur for customers in a higher age group. After a certain year it was not even possible to get a contract without providing the date of birth. So we can assume that the distribution of the missing age values does not cover the whole range of values, but are located at the right end of the distribution. The determination of an optimal replacement value for “age missing” has to consider this fact in form of a business rule.

The red area in the histogram thus is the "my aunt Susanne and her friends" group. In fact, they represent a specific customer segment: older, long term customers, who did not show affinity for product upgrades or contract changes. And they should be treated differently in marketing actions. Probably these customer have demand for specific hardware (phone with large keys, simple usage). Or they need special assistance through the customer care hotline.
Open your mind!
What do we statisticians learn from this story? The data that we analyse have a history! They do not only reflect the value that they measure, but are also influenced by the business process, the type of data collection and data storage. To generate good results, it is mandatory for us not only to look at the data from the statistical point of view. We also have to observe the business background. For statistical analysis, we have to consider that things happen randomly only very few cases. Let’s think twice when we treat features in the data like missing values, outliers and biases as random. Or whether we need to investigate the background and handle our data individually here.
Statistical methods and SAS can help here to decide whether missing values occur randomly or whether systematic patterns lie behind that. Methods to detect these patterns include tile charts for the missing value pattern as shown in my blog contribution from February 2013, or multivariate methods like principal components analyses for the missing value indicator. Another option is to use the missing Yes/No flag in a predictive model to analyse which variables are correlated with the fact that the date of birth is missing. In the case of my aunt Susanne, the flag would be “long term customer relationship” or “basic product bundle.”
Got your interest?
If this post arouses your interest, you can find more details in my new book, Data Quality for Analytics Using SAS, or you can download the slides from my presentation at Analytics 2013 in London. You can also find a picture-blog of my books here.


