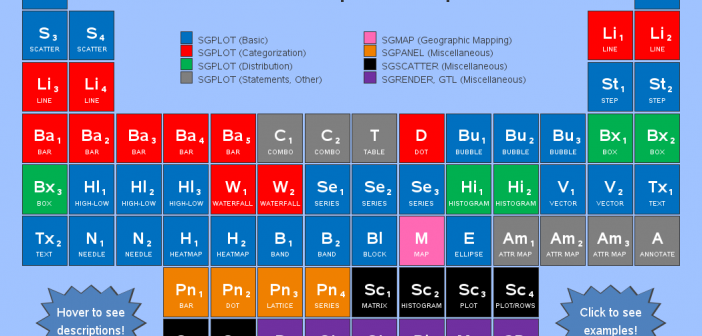
There were 97 e-posters in The Quad demo room at SAS Global Forum this year. And the one that caught my eye was Ted Conway's "Periodic Table of Introductory SAS ODS Graphics Examples." Here's a picture of Ted fielding some questions from an interested user... He created a nice/fun graphic,
Author
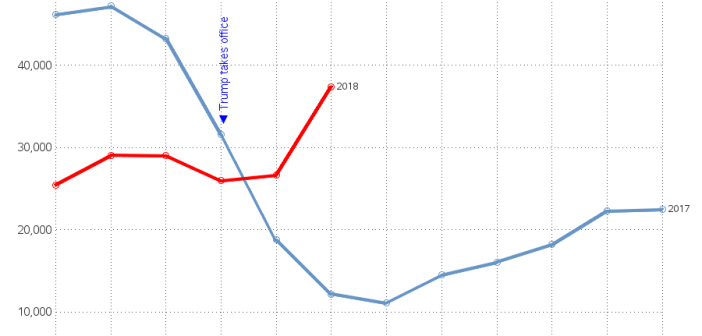
During the past few days, several news outlets told us that the number of illegal border crossings 'surged' in March 2018. This is a topic that interests me, therefore I wanted to see if the data supported what the news was claiming... Trump's desire to secure the US borders is
Being the Graph Guy, I wanted to know about all the "data visualization" presentations at the upcoming SAS Global Forum 2018 conference. I tried going through the official interface to search for such sessions, but it was difficult (impossible?) to know that I had found them all. Therefore I created
If you grew up as a space-junkie kid like me, then you've probably been watching the news for the past few days, wondering when and where China's Tiangong 1 space station was going to fall out of orbit, and crash to Earth. According to Popular MechanicsĀ (PM), that happened at 8:16pm
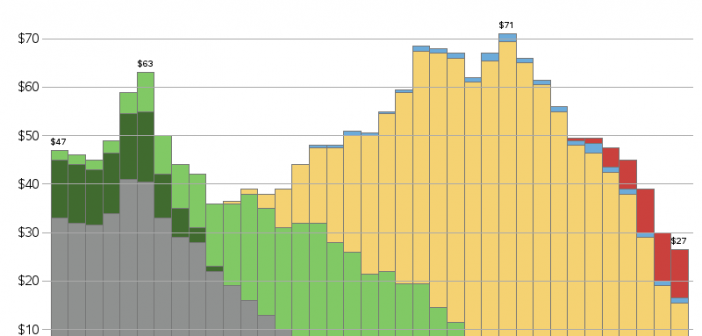
These days, it's all about music streaming ... You sign up for a service, you let them know your music preferences, and they create a virtual "radio station" that plays the songs you probably want to hear. But that just doesn't compare with going to a physical record store, buying
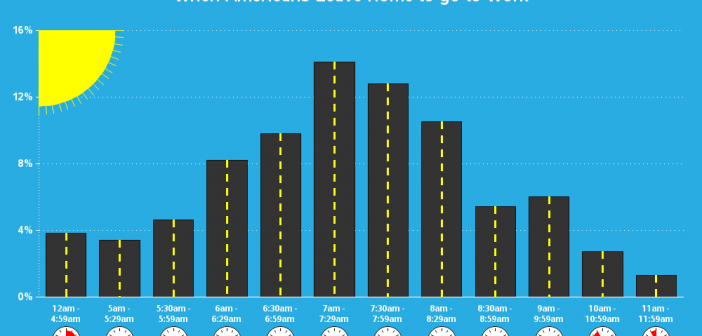
As the Research Triangle Park becomes more popular, we're getting a lot more traffic on the roads. And with flexible work hours, of course I try to pick a time to drive to work when there's less traffic. I recently saw a cool infographic showing the most popular times when
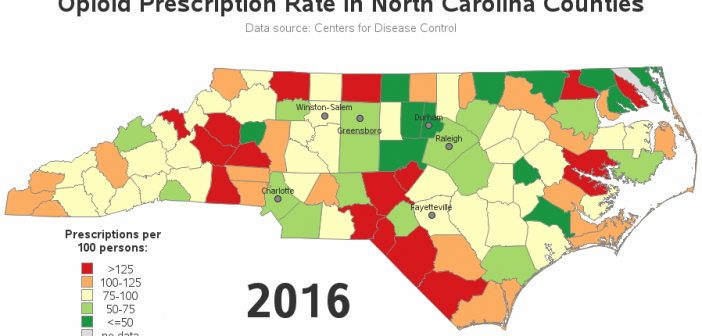
My buddy Rick Wicklin recently pointed me towards an animation of some opioid prescription rate data for Illinois. And, of course, I decided we needed a similar animation for North Carolina (with a few improvements...) Here's the original, and here are the problems that jump out at me: Counties with
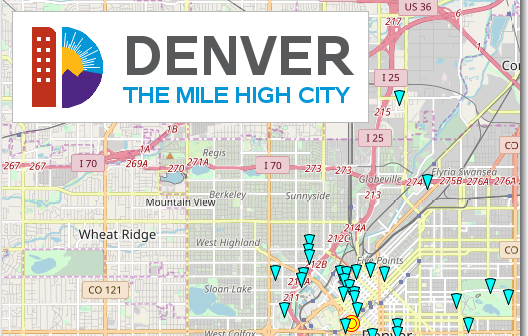
Are you going to Denver, Colorado, and wondering what fun/interesting/eclectic things you can do there? Then this is the map for you! For the past couple of years, I've made maps of the city SAS Global Forum is in, pointing out some of the attractions that conference attendees might want
Do you procrastinate and find excuses to delay doing certain things, even when you know they really ought to be done? And you probably realize that startingĀ those projects is usually the hardest part, eh? Well, I finally started converting hundreds of my SAS examples to use the new GfK maps,
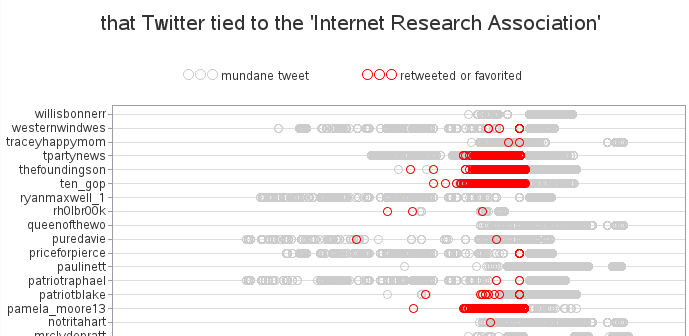
Unless you live under a rock, you've probably seen news reports that Russian trolls have been posting on social media to allegedly conduct "what they called information warfare against the United States, with the stated goal of spreading distrust toward the candidates and the political system in general," according to