SAS has been used to track the spread of many things, such as wild animals, tornadoes, and money launderers -- but this time I'm using it to track the spread of Walmart stores across the U.S. over time!
Since its start in the 1960s, Walmart has grown to be the largest retailer in the world.
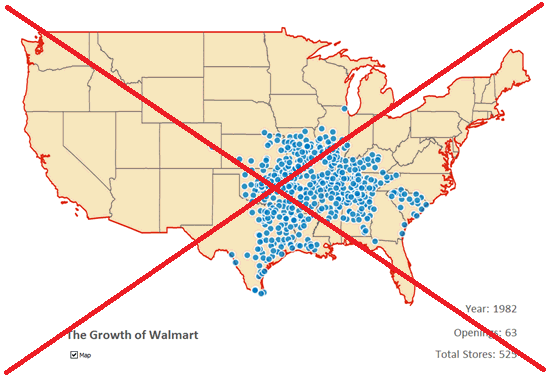
A while back, someone sent me a link to one of Daniel Ferry's blogs, where he had created an animation showing the spread of Walmarts on a map over time (see screen-capture below). I liked the idea, but I thought maybe I could create something a little better using SAS :)
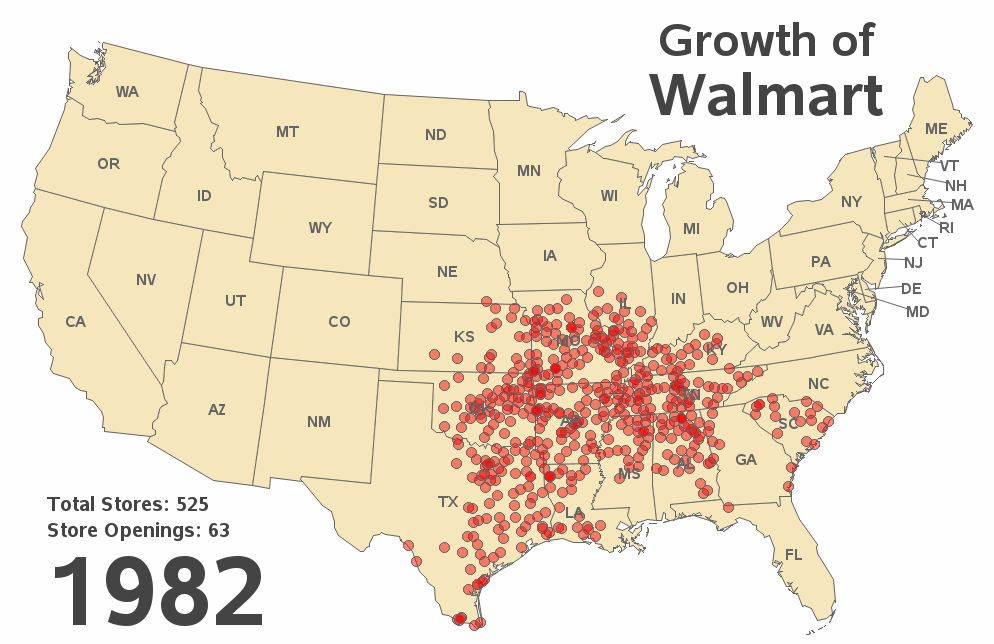
So I downloaded the raw data from the source that Daniel had linked in his blog. I used Proc Import to read in the CSV file, and then used Proc Geocode to estimate the latitude and longitude for each store. I drew the map using Proc Gmap, and annotated a marker on the map for each store.
I used the new (simpler) SAS 9.4 syntax to create the GIF animation, and this version of the software also (for the first time in SAS) supports the use of transparent colors in GIF animations (using transparent colors for the markers allows you to 'see' where multiple markers are stacking up in the same approximate location).
And now, without further delay, here's my version of the GIF animation - click this link, or click the thumbnail/snapshot image below to see the animation:
So, what do you think of the animation? Do you see any trends?
Any surprises, or did the Walmart stores branch out as you expected? :)


7 Comments
Pingback: Top 4 reasons to upgrade to SAS 9.4 | The SAS Training Post
The original source for this idea was from Nathan Yau. It can be found at http://projects.flowingdata.com/walmart/
Thanks for the link! I expect there are probably many versions out there, and I'm not sure which one would have been the "first ever" Walmart animation ... but it's interesting to see all the slightly different approaches. The Walmart animation on flowingdata reminds me of the Nuclear Explosions animation (http://www.youtube.com/watch?v=856fWEltiXo), except no sound effects or zooming-in.
Rob love all your graphing insight! For some reason I cant get the link to the animation to work. Tried in IE, Firefox, and Chrome.
Eric
Are you seeing a map that's not animated? A red 'x'? Any kind of error message? Do your browser settings allow gif animations? Do you have any co-workers you could get to try it on a different computer? I tried it in IE and Chrome just now, and it's working for me.
As an alternative, you might try going directly to the .gif, rather than the html file that points to the gif. Here's the URL, if you want to try that: http://robslink.com/SAS/democd66/walmart_openings.gif
Thanks for the reply Rob.
Once I added it as a trusted site it worked fine.
Eric
Excellent!