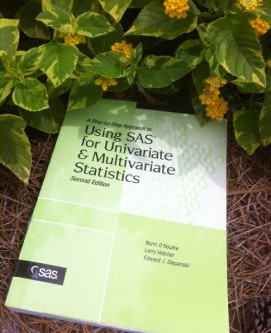
 This week's SAS author's tip comes from a large green book that many of you are familiar with: A Step-by-Step Approach to Using SAS for Univariate & Multivariate Statistics, Second Edition by Norm O'Rourke, Larry Hatcher, and Edward J. Stepanski. Despite its massive size, this isn't an intimidating text. The authors ease you into learning everything you need to know about statistical analyses using SAS. And it's the perfect book to tie in with the start of a new college semester. SAS users have endorsed its value for students, professors, researchers, and data analysts.
The following excerpt is from SAS Press authors Norm O' Rourke's, Larry Hatcher's and Edward J. Stepanski's book A Step-by-Step Approach to Using SAS for Univariate and Multivariate Statistics, Second Edition, Copyright © 2005, SAS Institute Inc., Cary, North Carolina, USA. ALL RIGHTS RESERVED. (please note that results may vary depending on your version of SAS software)
Options Used with PROC CORR
The following items are some of the PROC CORR options that you might find especially useful when conducting social science research. Remember that the option names should appear before the semicolon that ends the PROC CORR statement:
ALPHA
prints coefficient alpha (a measure of scale reliability) for the variables listed in the VAR statement. (Chapter 7 deals with coefficient alpha in greater detail.)
COV
prints covariances between the variables. This is useful when you need a variance-covariance table, rather than a table of correlations.
KENDALL
prints Kendall’s tau-b coefficient, a measure of bivariate association for variables assessed at the ordinal level.
NOMISS
drops from the analysis any observation (participant) with missing data on any of the variables listed in the VAR statement. Using this option ensures that all correlations are based on exactly the same observations (and, therefore, on the same number of observations.)
NOPROB
prevents the printing of p values associated with the correlations.
RANK
for each variable, reorders the correlations from highest to lowest (in absolute value) and prints them in this order.
SPEARMAN
prints Spearman correlations, which are appropriate for variables measured on an ordinal level. Spearman correlations are discussed in the following section.
You can find more information about the book including a free chapter and reviews from SAS users here! And please share your experiences using the book by commenting on this post.


1 Comment
Pingback: SAS author’s tip: writing LSMEANS statements - The SAS Bookshelf