Get the right information, with visual impact, to the people who need it
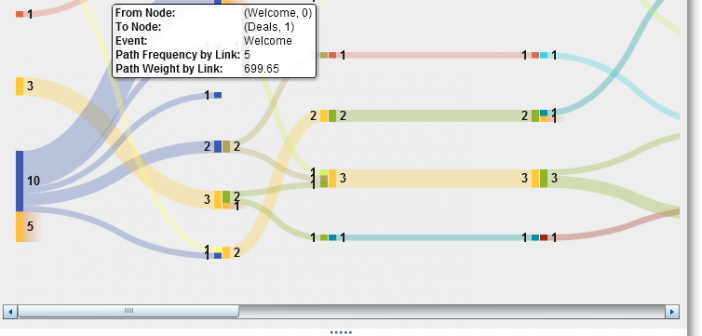
Introduction Understanding the behavior of your customers is key to improving and maintaining revenue streams. It is a an important part when crafting successful marketing campaigns. With SAS Visual Analytics 7.1 you can analyze, explore and visualize user behavior, click paths and other event-based scenarios. Monitoring the customer journey by visualizing

