Recently, I was reading an online article about predictive modeling and "big data." Its premise was to determine whether the use of big data actually led to more accurate and meaningful predictive models and forecasts. After citing numerous external examples and internal tests that the authors had compiled, it stated that big data was a better asset for creating more meaningful and accurate predictive models. It also suggested that organizations with big data assets and the personnel and skills able to utilize these assets, could achieve a competitive advantage over those organizations that did not have or exploit big data.
Thinking more about it, over the last few years I’ve heard this was generally the case. So, I decided to use SAS Visual Analytics and its forecasting capabilities with a relatively small dataset (for SAS, that is) to see what I could discover as related to this notion. I wanted to see how forecasted values would be influenced by using varying amounts and combinations of the data.
Now, before anyone calls me out for being unscientific or a statistical kindergartner, this is not meant to be an in-depth predictive modeling exercise as utilized by the above mentioned article. It is, simply, an investigation spurred on by curiosity and the ease with which such things can be explored and visualized using SAS VA, in this case VA’s forecasting functionality.
The data
The dataset I used contains 2.038 million rows and 46 variables. The data lists and describes fleet vehicle Fault and Critical Fault maintenance information from August 2001 through June 2012. For this exercise, I was comparing forecasts for Fault and Critical Fault with various influencing measures and varying amounts of the older vs. newest records. I did not include any filters, ranks or hierarchies and only used measures, no category variables. All in all, pretty simple.
The exercise: round 1
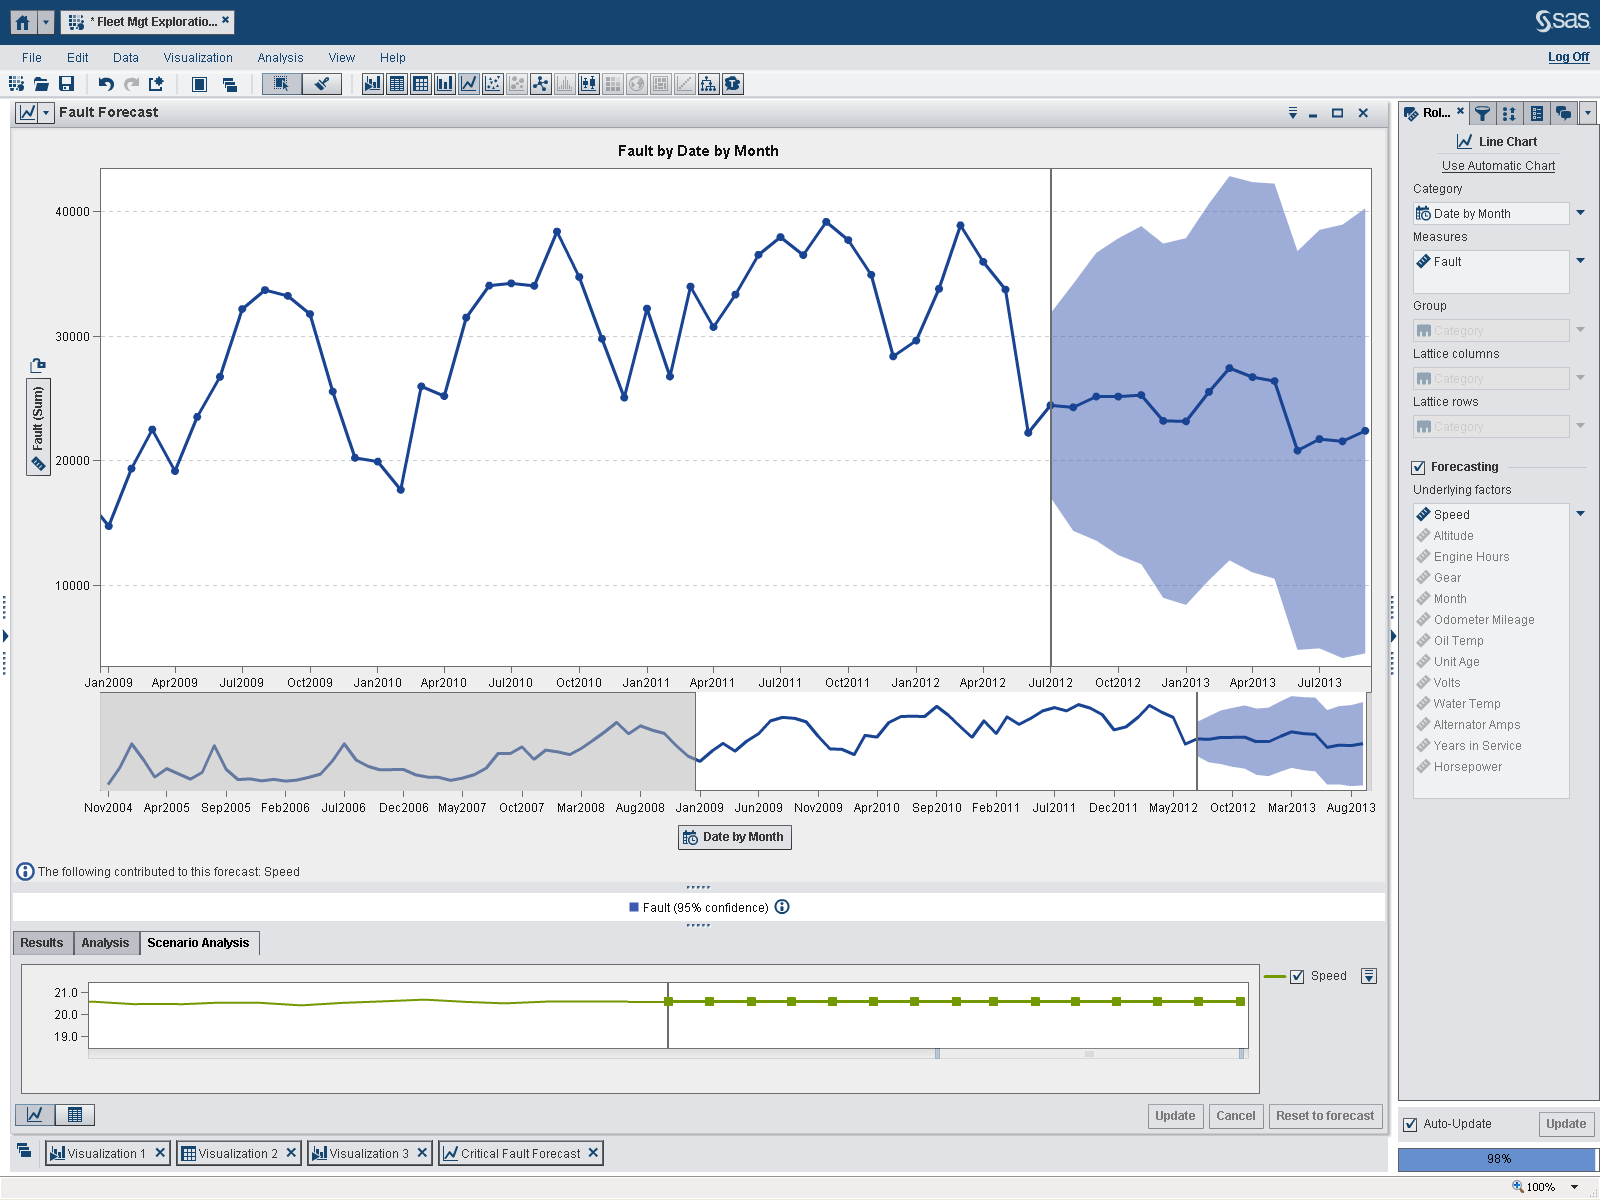
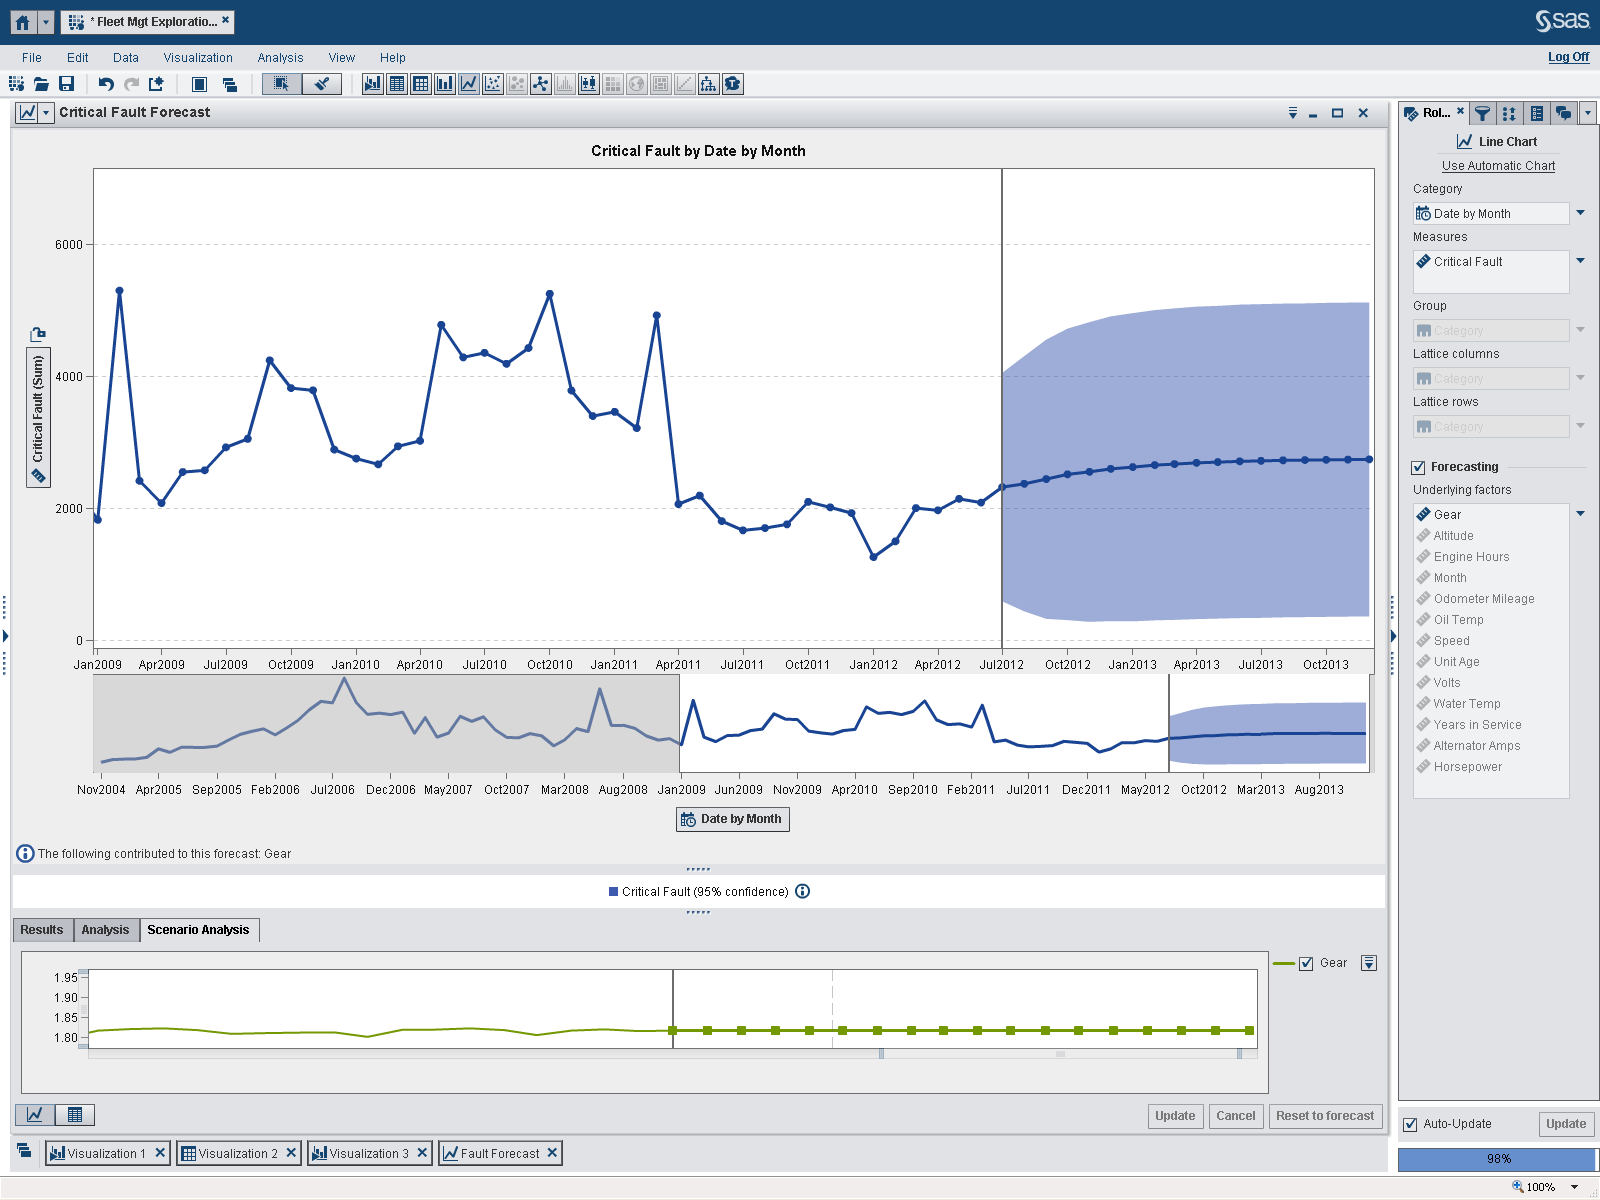
These first two examples for Fault and Critical Fault use all the data. Each example forecasts fifteen periods at a 95 percent confidence limit. Notice the “Underlying Factors” to the right of the forecast where only the Years in Service variable is listed as having any influence on the forecast, as determined by SAS. Otherwise, I took all the SAS defaults provided.
The exercise: round 2
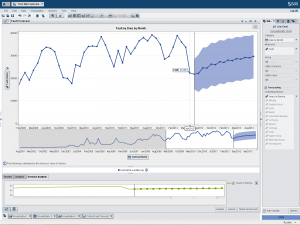
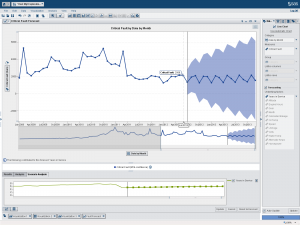
One of the first things I noted is that the data for the first few years of these forecasts are relatively flat and constant (look in the preview pane under each larger, forecast panel). So, for the next iteration I excluded the data for these “flat” years. Notice how removing the August 2001 through October 2004 records significantly alters the forecasted values. Also notice that the “underlying factors” for each forecast have changed. As indicated in the lower right of the screen, I am now using 98 percent of the records, still a significant amount of the original data.
The exercise: round 3
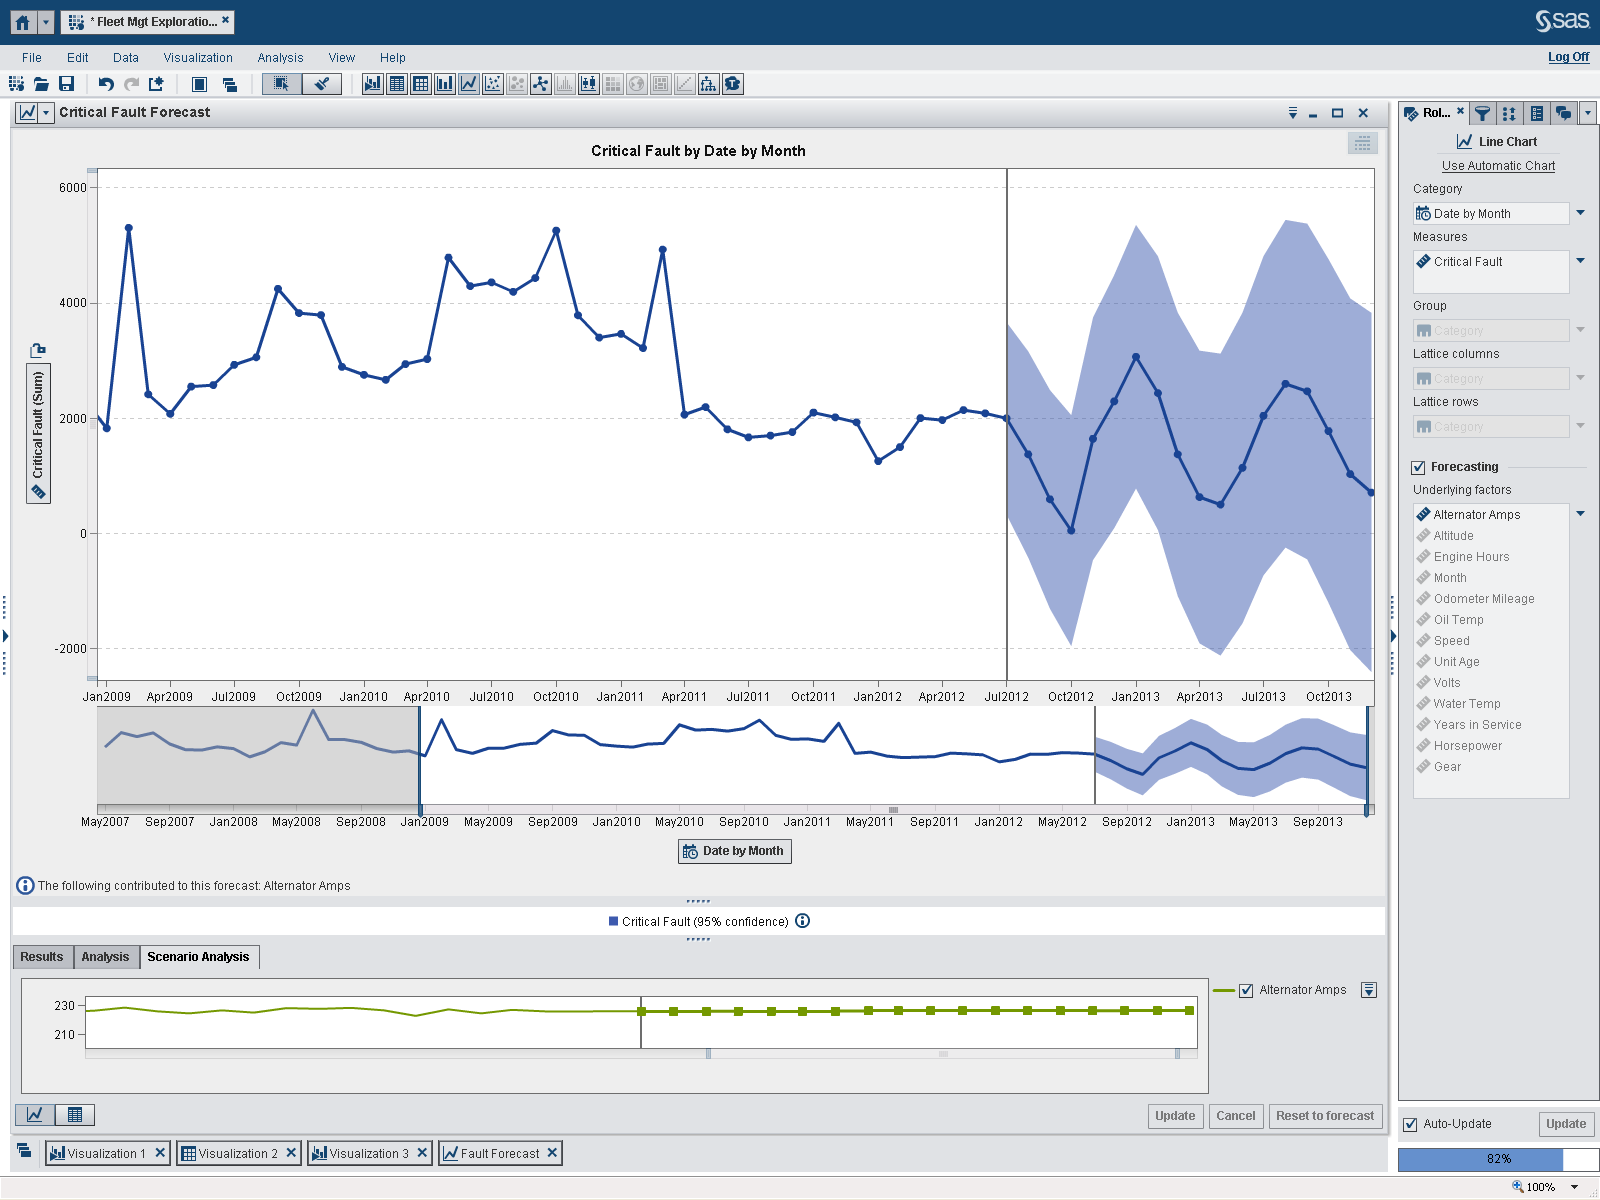
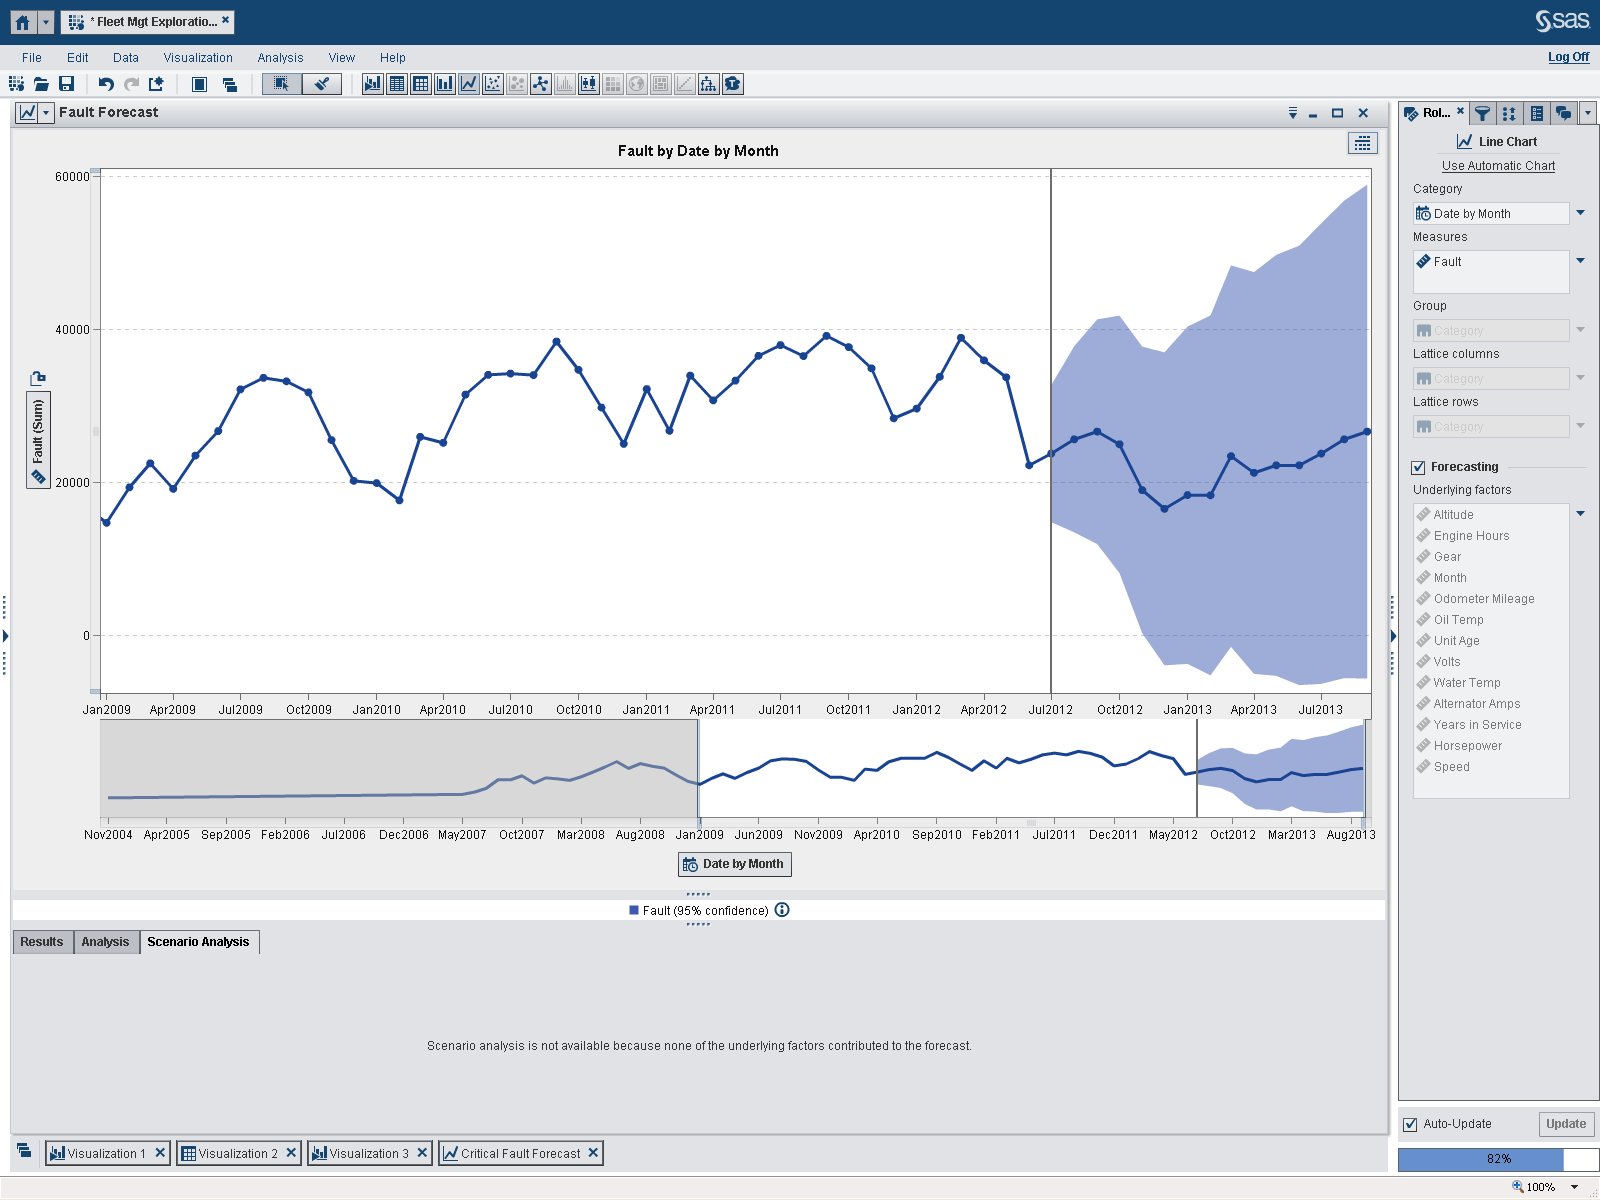
I then took it one step further and ran a forecast with only data from the last five years. The forecast now uses June 2007 through June 2012. As indicated on the bottom right of the screen, we are still using 82 percent of the overall data. Again, notice how the underlying factors have changed for each forecast. For fault, there are no underlying factors that now influence the forecast. For critical fault, the forecast goes from relatively flat and stable to highly variable.
In summary
As demonstrated at a high-level, there are very real differences among the various forecasts that were produced utilizing varying amounts of historical data. Are these significant enough to warrant further investigation? Possibly.
My exercise also seems to indicate that more historical data (big data) “could” contribute to better and more meaningful predictive models. Or, conversely, less meaningful results due to the clutter and noise of irrelevant historical information vs. what is actually relevant in the here-and-now.
That is not to say, however, that less data is not useful. The argument can be made that what happened with our data fifteen years ago is VERY different than what has been recorded within the last seven years. Things change, this is a fact. But, it definitely warrants further investigation by those with the data, skills and time to delve into it.
Obviously, this is by no means a genuine predictive model in the SAS realm of what is possible with SAS Enterprise Miner, SAS Forecast Server and SAS/ETS. And, I’ve only scratched the surface as to what permutations of the data could be utilized to dive deeper into a more meaningful forecasting exercise with SAS VA. What I hope you will gather from this is that SAS VA provides a great platform to “explore” your data and ideas. I used VA’s forecasting visualizations as a business user may do to “explore” an idea or hunch. Easy-to-use, “approachable analytics” for everyone.
Again, I did this to provide an avenue for discussion and to solicit your input and thoughts about whether big data is truly an asset for such modeling, regardless of whether you're using SAS Visual Analytics, Enterprise Miner, Forecast Server or another product for forecasting.
Thoughts?

2 Comments
A great discussion topic, I often wonder about this as well. As someone that swims in massive amounts of data on a daily basis, I would be among the last to say don't give me more data. However, there is a cost to more data that people don't mention, that is, while more relevant data is always appreciated, more irrelevant data causes a lot of investigative work to show that they don't provide value, that's time and energy that could've been spent more wisely. Adding massive amounts of irrelevant data will uncover spurious correlations that are not causal or even plausible, and they need to be reviewed, debunked, and stripped out. More relevant data = good, more irrelevant data = bad, so in the Big Data land, massive compute power, discernment and judgement becomes even more necessary than before. Just bigger for bigger sake is not necessarily wiser, unfortunately today most people equate bigger = better, and there's insufficient talk about the dark side of Big Data. There is no free lunch.
Hi Philip,
Thanks for your post. It is a good demonstration on how a forecast is dependent on its past values... If the quality of the data is poor or not representative of what is happening now, it will produce a poor forecast. Having more data does not mean a better forecast. It means you have more representative information on the series to help predict its future.
A forecaster would be wise to question the data and become familiar of other influences and events which could also have an impact on the forecast. As you've shown above, SAS Visual Analytics Explorer allows one to easily undertake the exploratory steps to streamline the discovery phase of the analytics life cycle to perhaps later set up the production models in SAS Enterprise Miner, SAS Forecast Studio or other application. SAS Visual Analytics allows you to "Look before you leap..." http://blogs.sas.com/content/anz/2013/03/06/look-before-you-leap-with-data-visualisation/
Kind Regards,
Michelle