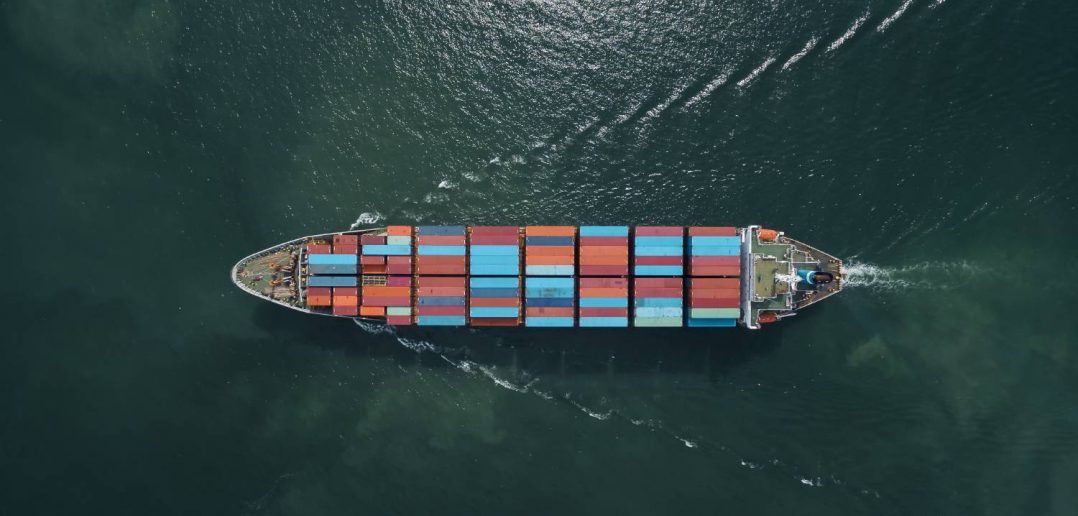
Rijkswaterstaat (RWS) is the Netherlands main agency for design, construction, management and maintenance for waterways and infrastructure. Their mission is to promote safety, mobility and quality of life in the Netherlands. They are the masterminds behind some of the most prestigious water projects in the world. In a recent panel discussion with some of the project leaders at RWS, they told us about some of their latest projects and how SAS is helping fulfill the RWS mission to keep the Netherlands’ waterways safe and efficient.
Learn more about RijkswaterstaatMeet the Panel
Q: Can you introduce us to Rijkswaterstaat? What are you working on today?
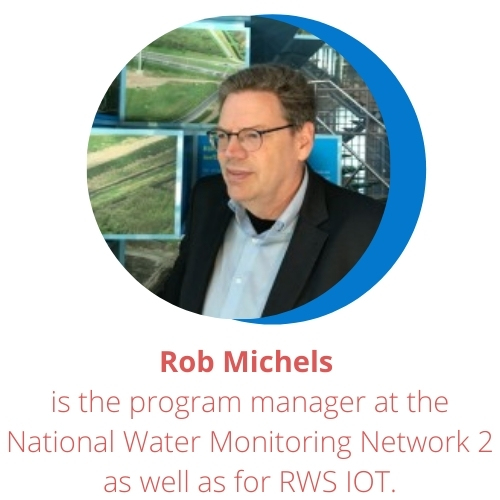
Rob Michels: RWS is a part of the Dutch government. We oversee roads and, most importantly, the water system. That’s essential for us. A large part of the Netherlands is below sea level, so it's a very important task to keep us safe. Because water is such an unpredictable environment, we have lots of sensors and data. In the past, we had lots of data collection solutions for each system including real-time and video sensor data. Having so many solutions became overwhelming, and in 2018 we decided it was time to have only one data collection system. This system is what we are talking about today.
Q: What is the role of SAS in the product?
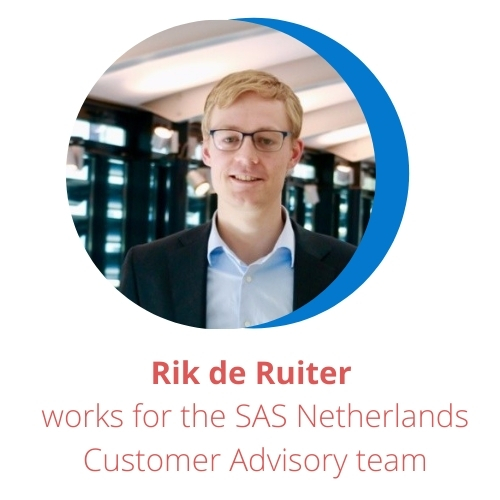
Rik de Ruiter: SAS’ role was really on the analytics side. One of the main parts we looked at was the LIDAR system. A LIDAR [light detection and ranging]system generates tremendous amounts of data — up to about 655,000 data points per second. So, while we had plenty of data, we had to ask, “How do you translate that data into insights?” That’s where SAS came in. SAS can translate that data and make it very easy for us to be able to gather comprehensive insights. One thing a lot of people might not realize is that the data needs to be analyzed right away, otherwise it’s useless. SAS allows the translation to be done immediately so we can benefit from all our incoming information.
Q: What applications do you see for this technology?
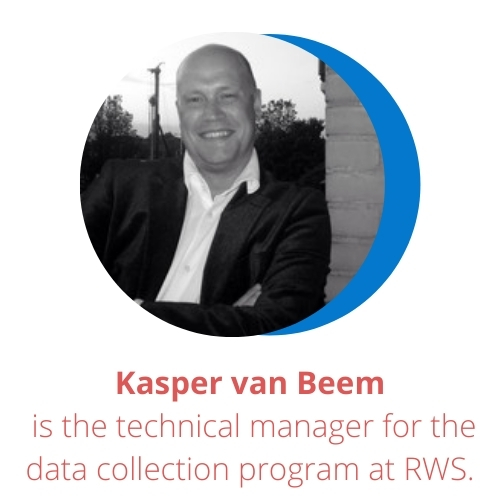
Kasper van Beem: Rob [Michels] was getting a lot of attention with all his data-combining products, so as he gets more requests, we're trying all different kinds of technologies together. These technologies, with the help of event-stream processing, make it possible to combine different data streams that, five years ago, people didn't even think of combining. We are even currently working on expanding the technology to road systems and expanding the water system capacity.
Q: What is SAS Event Stream Processing and how does it work at the Edge?
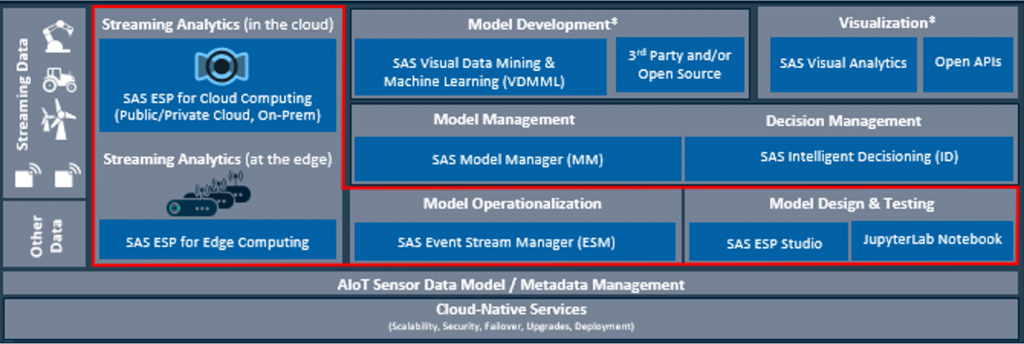
Figure 1. SAS streaming analytics at the edge
Rik de Ruiter: SAS® Event Stream Processing is all about real-time analytics. Edge devices are basically a minicomputer and can process thousands of data points. So, deploying the analytics gained from SAS Event Stream Processing on edge devices allows for large amounts of data to be processed very quickly.
Rob Michels: To create overarching monitoring of all the data sets together, we created a data store using SAS Event Stream Processing. We did this because we didn’t want to develop software, we want to configure it. We wanted to innovate solutions quickly for use-cases. In the older environments, when you add in a sensor or solution, it would take a long time before you got any data out of it. Now, our use cases take a couple of weeks versus half a year.
Q: What is a current use case?
Kasper van Beem: At the end of last year, an asset manager from the northern Netherlands came to us wanting to know what kind of road traffic and ships were going to and from the northern Netherlands. There was a spot where he wanted to know what kind of ships were pausing there, how broad they are, how high they are, how fast they are going, and are they going against the stream. We quickly ended up with a LIDAR-based solution using our data collection chain. Now, when a ship is passing, you can take data from another system and immediately know the ship and its captain. If the ship goes against traffic, we might notify the captain to change directions. We can also use the same technology to try to make parts of the roads safer just by monitoring it, making sure that everything is safe before a bridge opens.
Q: Why is this kind of visualization important to RWS management?
Kasper van Beem: Because water is constantly moving up and down and some ships are taller, it might be more efficient to build a higher bridge so that all traffic can go through. The main thing that we look at is what type of ships are going through our canals. So, the visualizations allow RWS management to see in which channel a ship was, its direction and dimension, but also its speed and its classification every time it passes a LIDAR sensor. The visualization allows them to see all this data in a comprehensible format.
“To create an overarching monitoring of all the data sets together, we created a data store with SAS Event Stream Processing. In the older environments, when you add in a sensor or solution, it would take a long time before you got any data out of it. Now, our use-cases take a couple of weeks versus half a year."
-Rob Michels, project manager, RWS
Q: What is the future of IoT at RWS?
Rob Michels: We will continue to grow. All our technology is getting smarter and able to collect more and more data every day. This immense data is all getting combined. However, you don’t want to combine data six months later, you want to do it in real-time. That's the data’s real value. So, our mission is to make sure our data has maximum value.
Kasper van Beem: We also already have several projects started. Today we talked about LIDAR, but we also did a startup proof of concept for radar systems. We are creating road measurement systems, constructing an alerting system by applying what we’ve learned about waterways to road systems and working on predictive maintenance. Not only will we measure how long equipment has been used, but we’re also going to measure vibrations and harmonics to determine if something needs to be fixed before it breaks down. However, our main project is still focused on the water management system of Rijkswaterstaat. The system consists of 2,000 sensors – not including colleague countries that give us their river and seas data for all of northern Europe. The sensors are where we measure all the water levels and water flows. This acts as a decision support system for us. So, the other part of our vision is to build a system that can be used in all domains.
Learn more about streaming analytics and SAS Event Stream Processing.
