Have you ever wondered if love at first sight really exists? And if it exists, what qualities are people drawn too? Watch any romantic comedy and you’ll see this phenomenon play out on the big screen. Which begs the question, “If it can happen to them why not me?”
Let’s take emotion out of the conversation. Instead, we’ll use logic and data to uncover answers about love at first sight, with machine learning as our vehicle.
We're making it easy for anyone to analyze and visualize speed dating data collected by Columbia University and hosted by Kaggle using a free trial of SAS® Visual Data Mining and Machine Learning.
Whether you’re a business analyst, citizen data scientist or a data scientist, you’ll have the opportunity to explore speed dating data during the SAS® Visual Data Mining and Machine Learning trial. The trial is set up to walk users through all the cool features this software offers while tapping into the power of machine learning to discover if love at first sight is authentic or absurd.
Analyzing the love data
The first time you log in to the free trial, you’ll see an overview of the data.
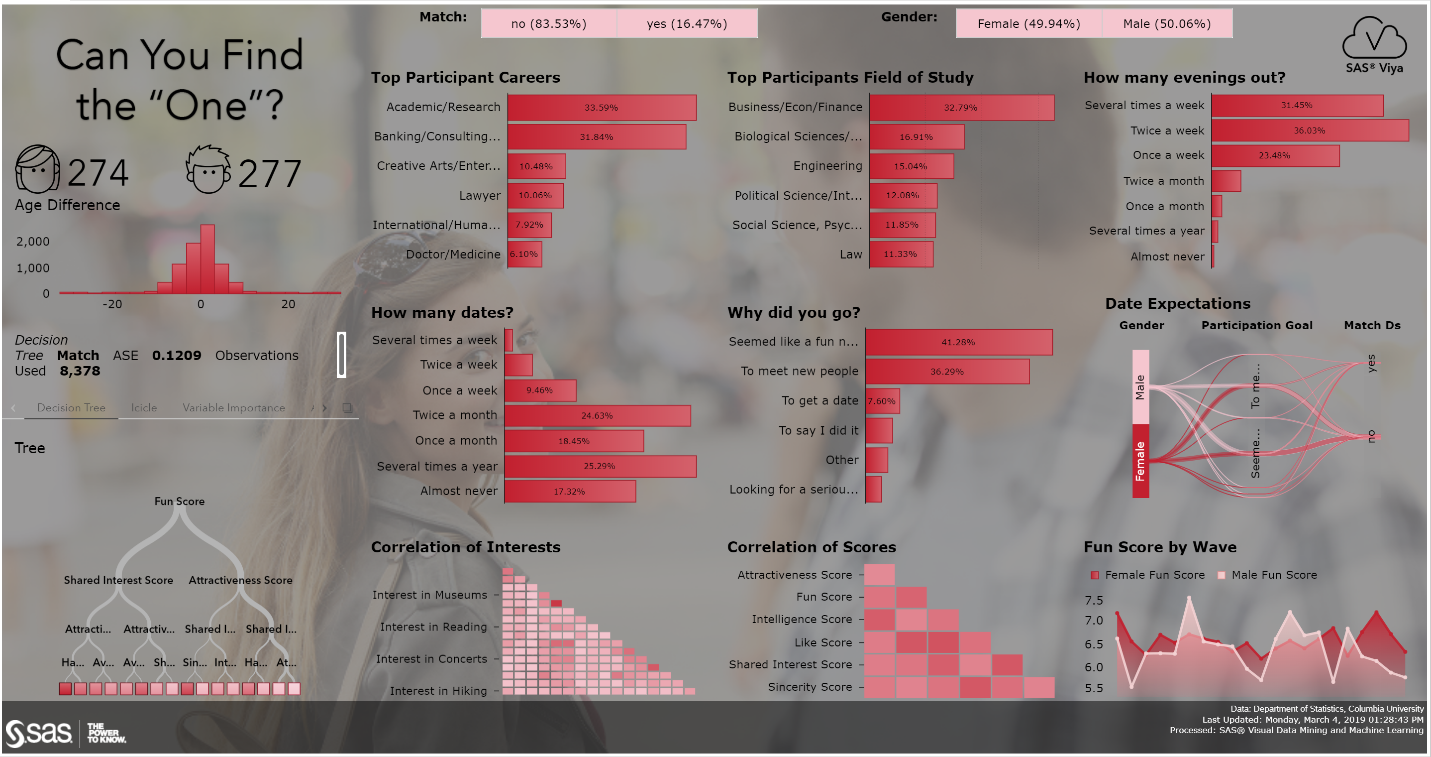
Here you can quickly see that even people who are super social and go out frequently tend to prefer group activities to individual dates. Another thing that jumps out at me is that we can already see one of the most important attributes to finding THE ONE: how fun a person is.
The data says love is supposed to be fun
After reviewing these visualizations, you’ll explore and visualize the data in more detail. You’ll use a SAS machine learning object – automated analysis – to rapidly uncover how certain attributes influenced a match. Automated analysis provides valuable insights in easy-to-understand text that’s generated using natural language processing.
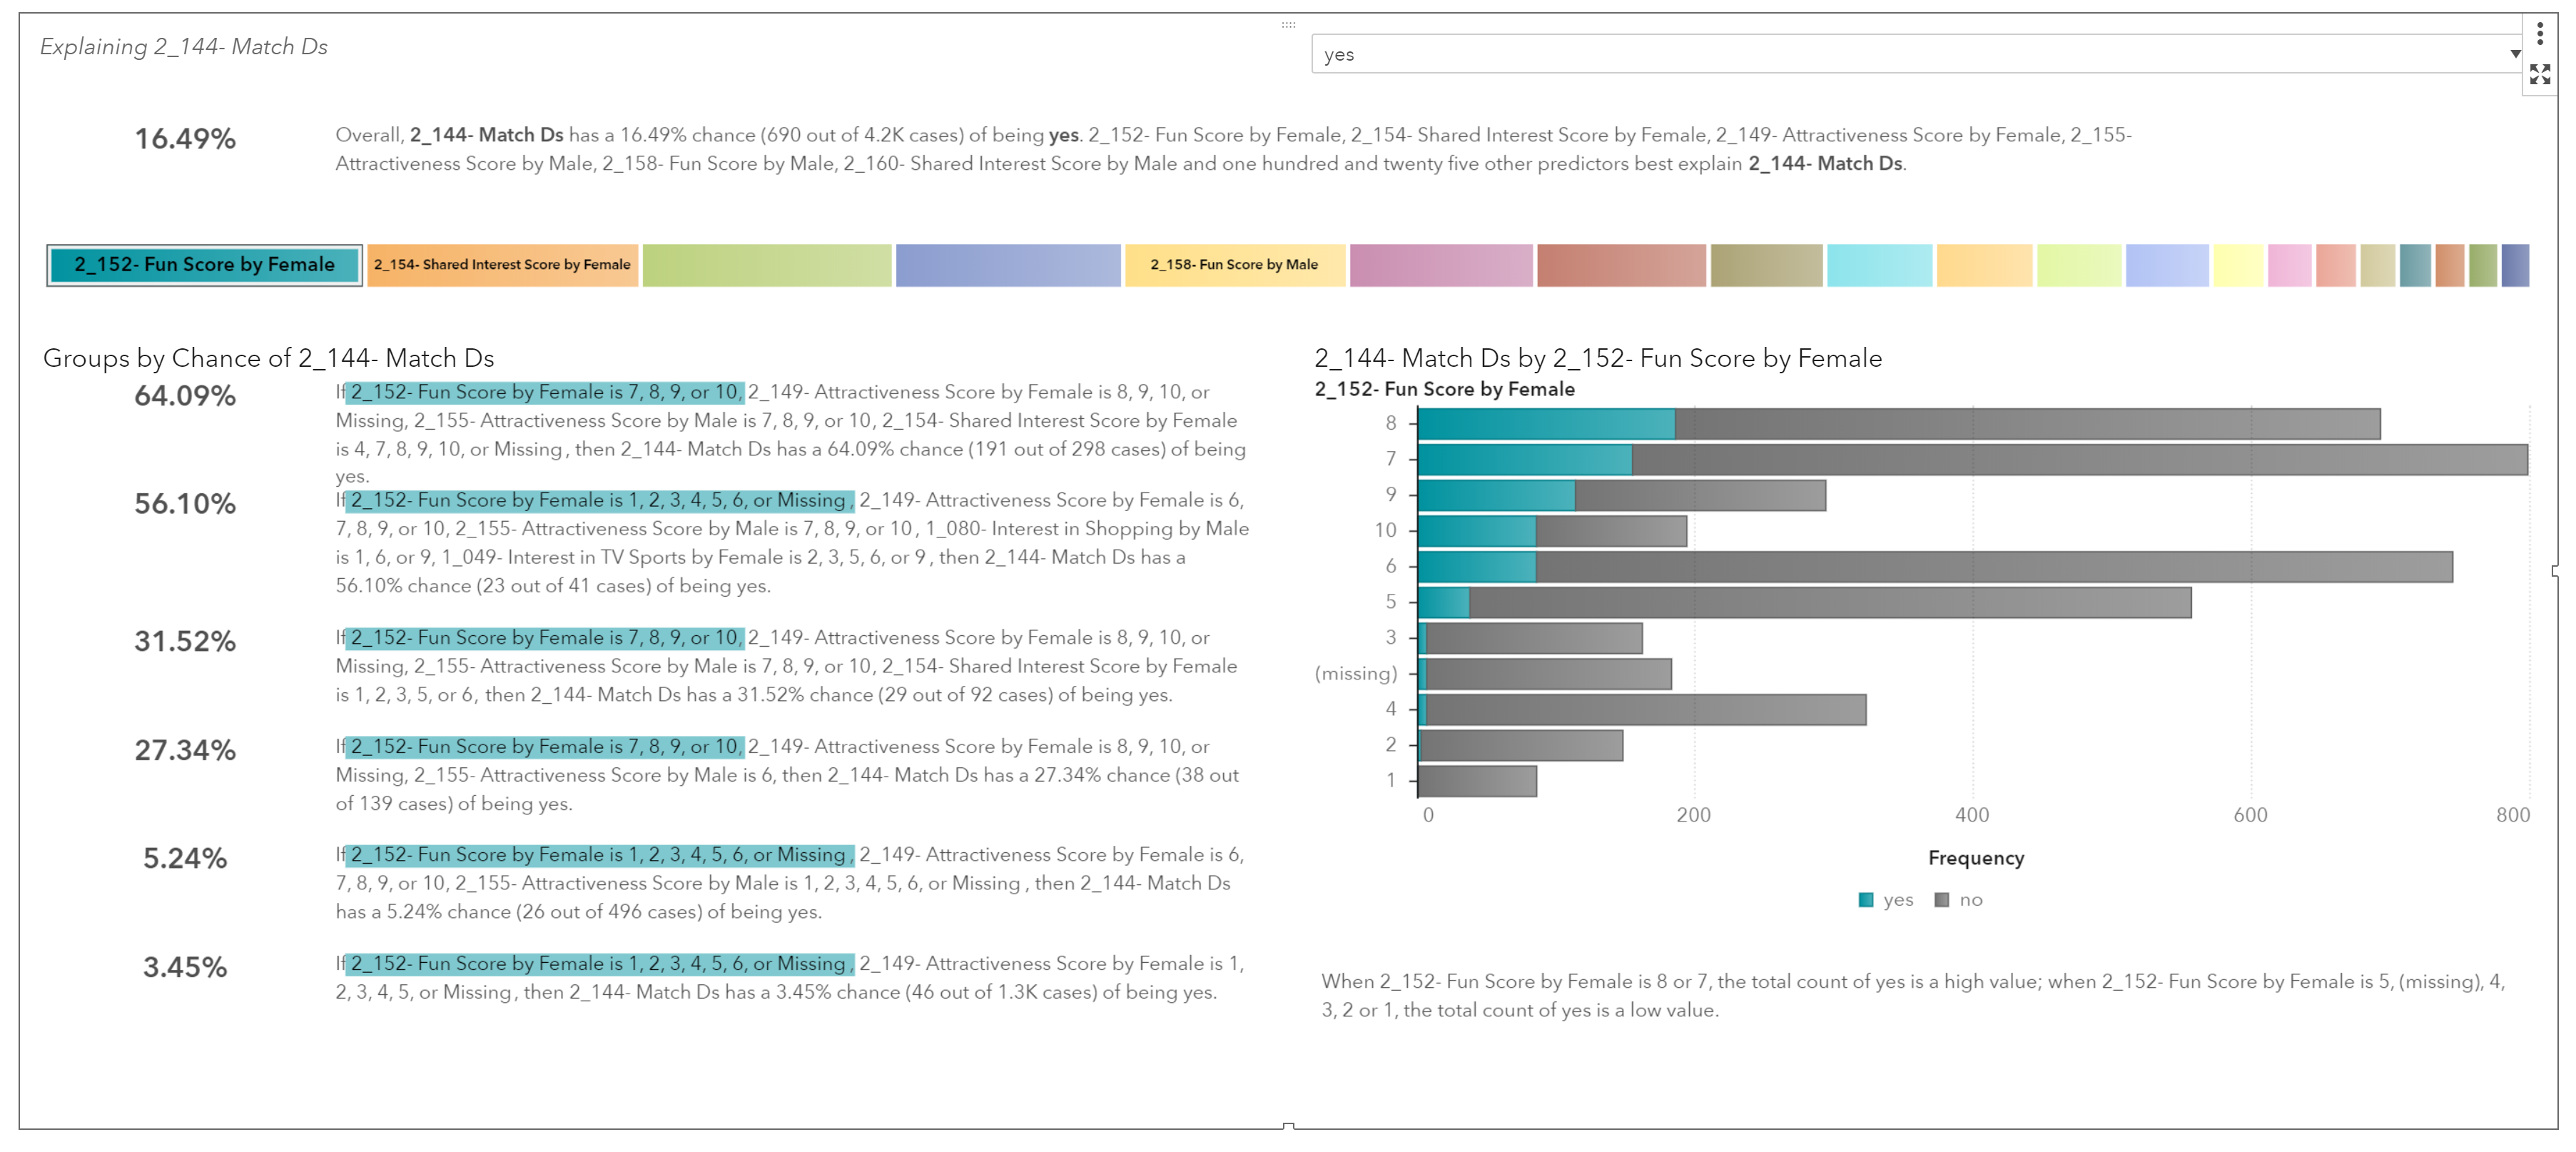
This visualization reveals that out of approximately 4,000 speed dates, 690 ended in a match (16.49 percent)! The biggest influencers are how fun the male was, if the male shared interests with the female, how attractive the male was and how fun the female was.
We also see the probability of a match. For example, the first group listed on the left shows 64.09 percent odds. The chart on the right displays how the selected variable, 2_152 – Fun Score by Female (how fun the male was) relates to our variable of interest (match).
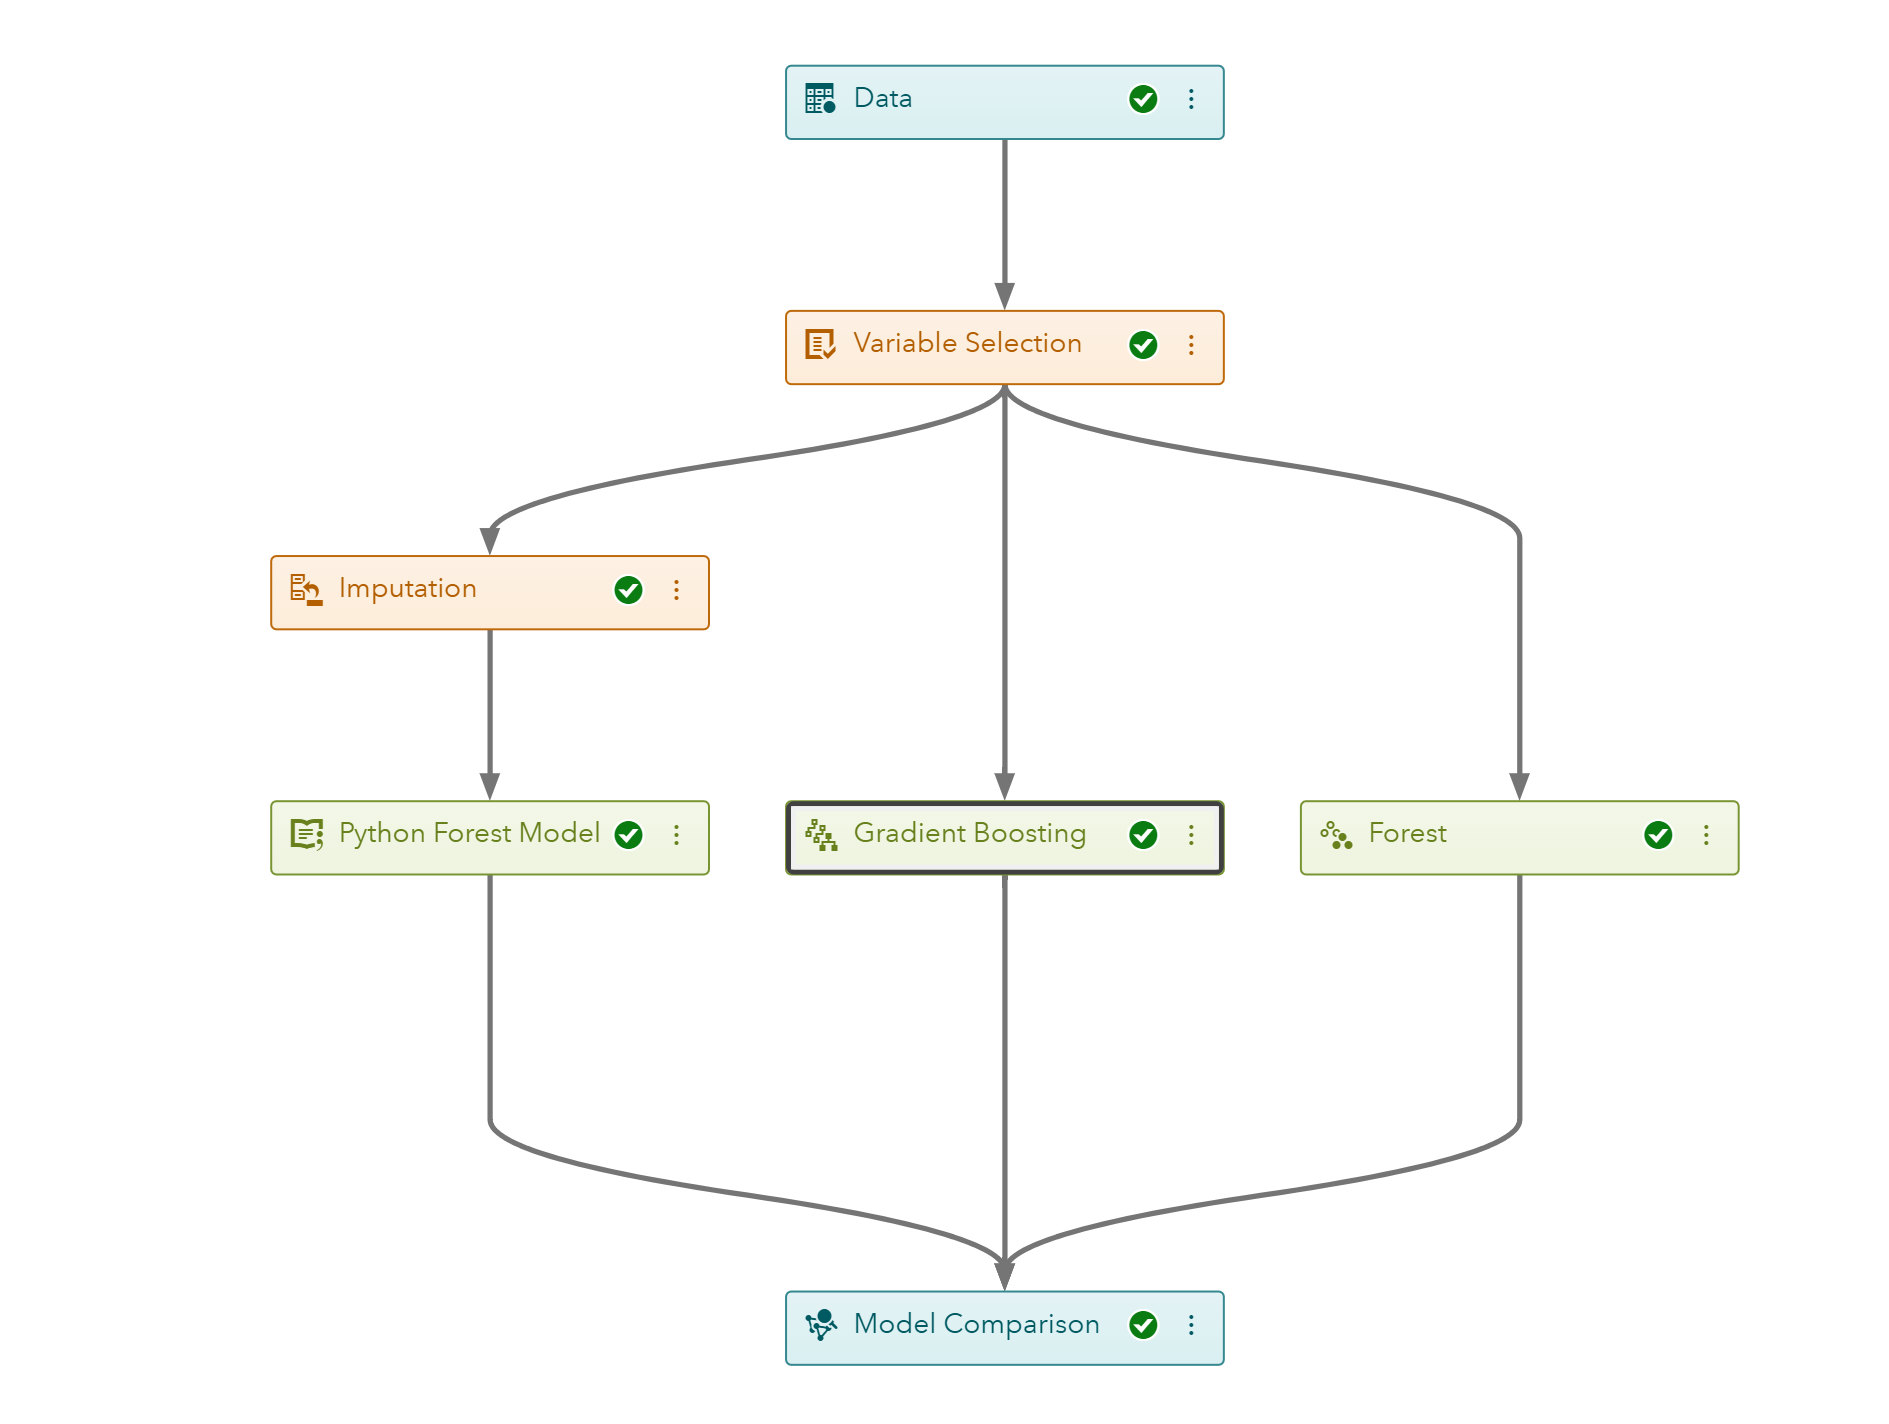
Building more complex models
After we’ve performed our automated analysis we’ll build a few quick models, such as a decision tree and gradient boosting to discover what influences a match between two people. Want to see which are the best predictors? Sign up for the free trial!
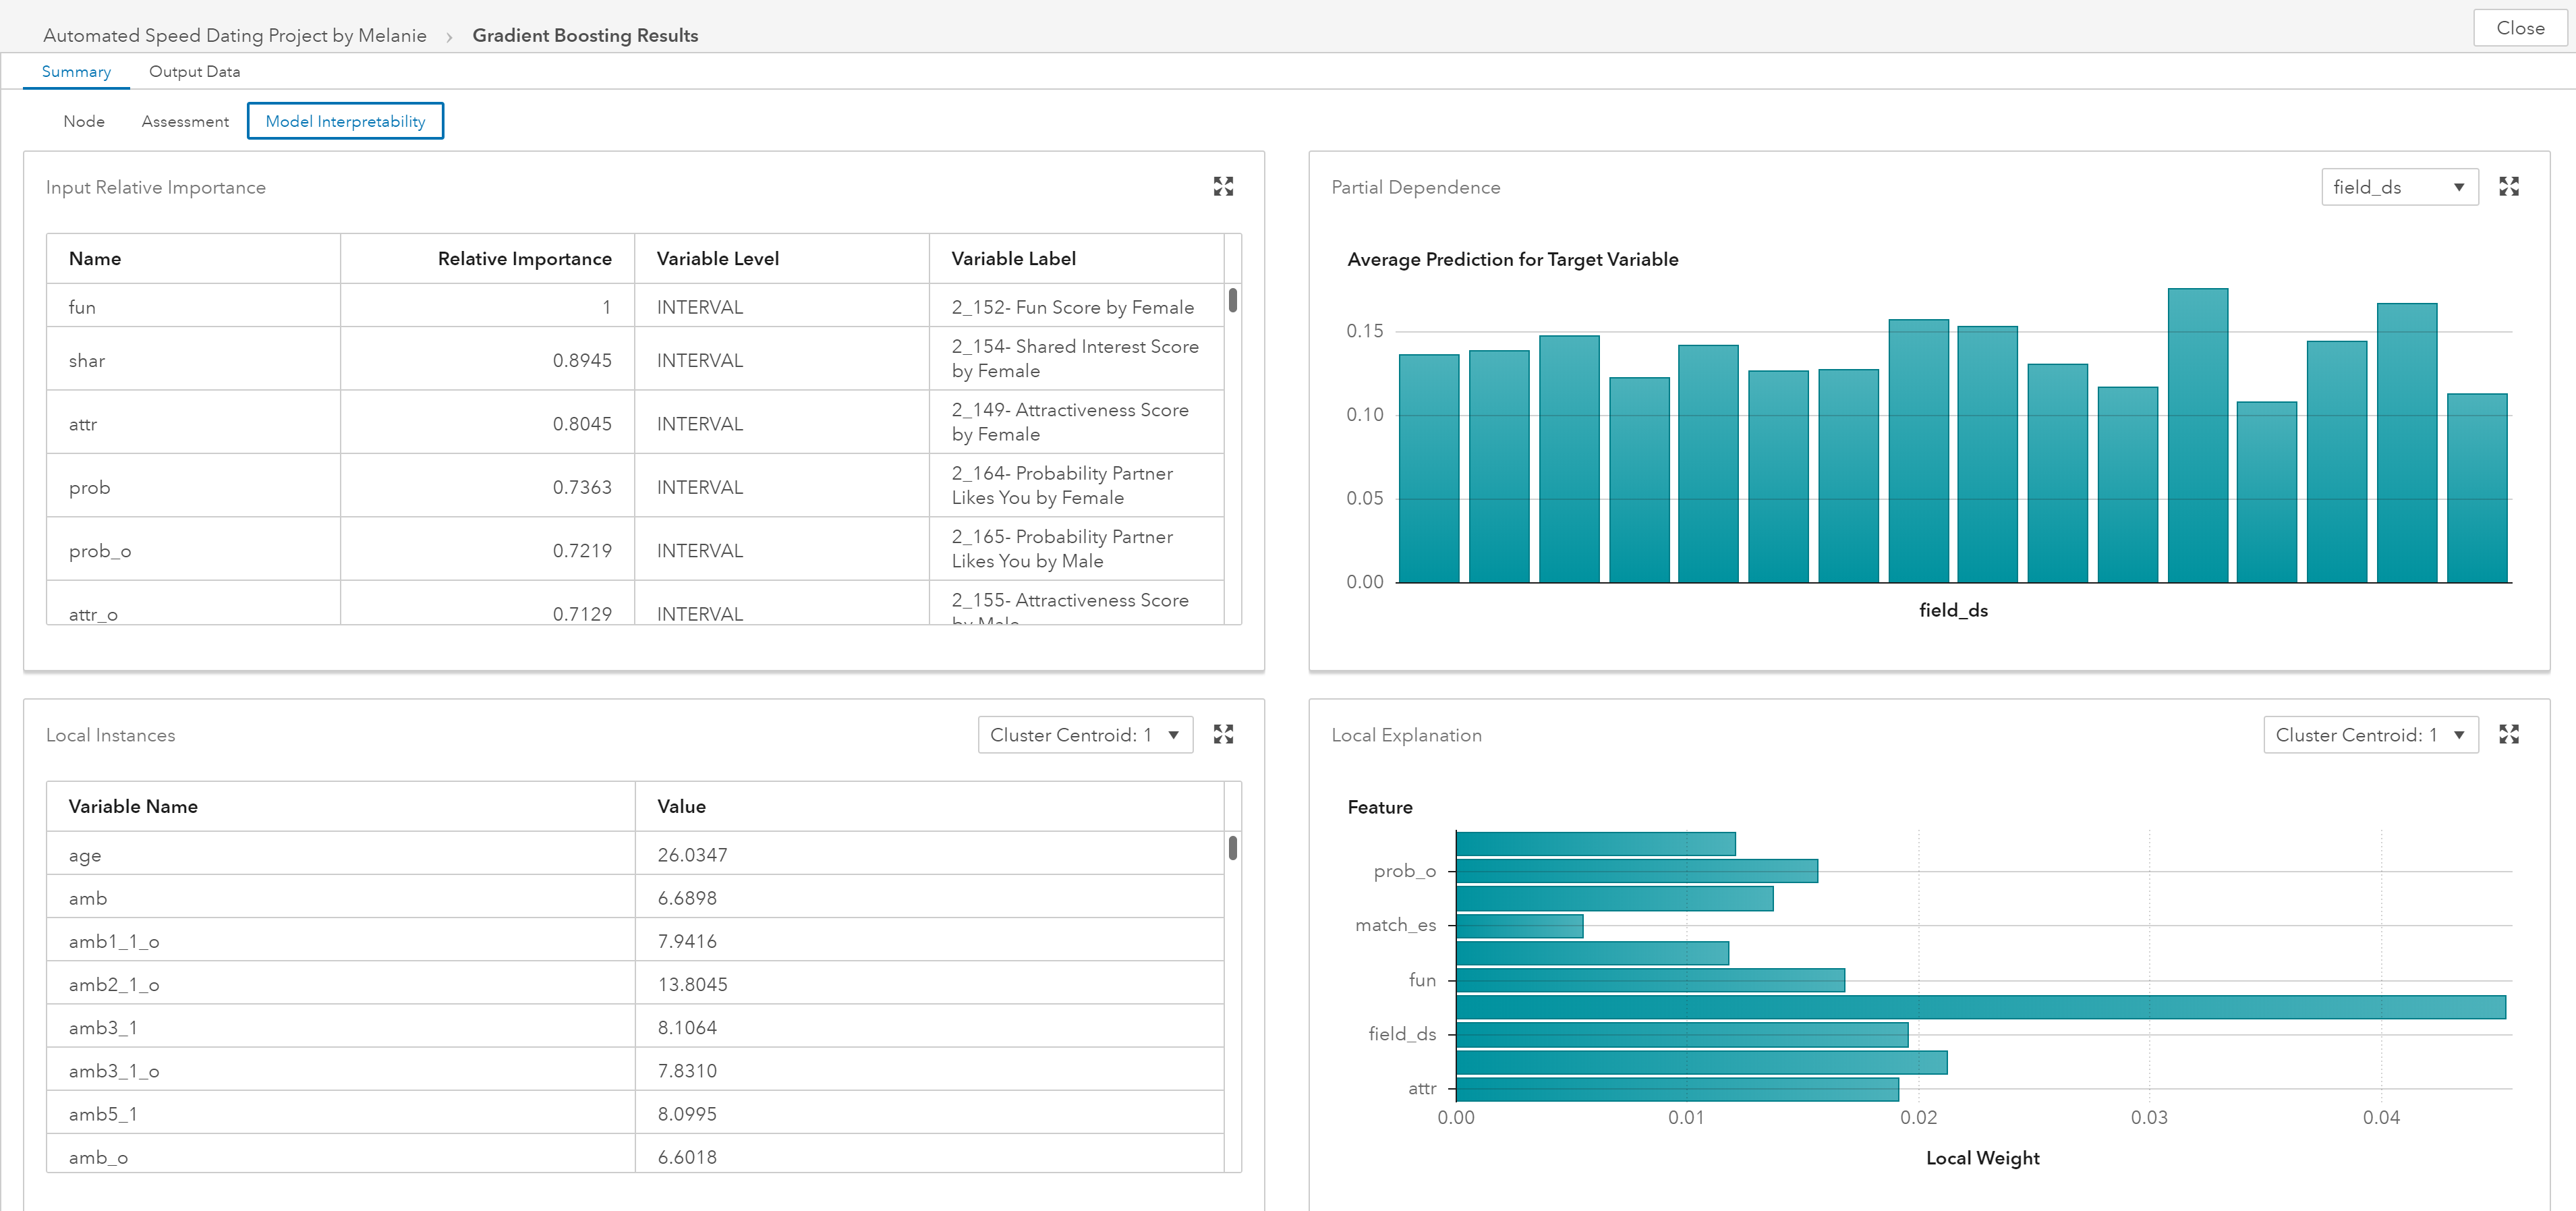
We don’t stop there. We dig in and start building more advanced models where you’ll have even more control over model options leading to better outcomes. Not only will we show and interpret our LIME results for our gradient boosting model, but we’ll also compare it to an open source python model! Curious to know which model is chosen as the champion? Sign up for a FREE Trial!
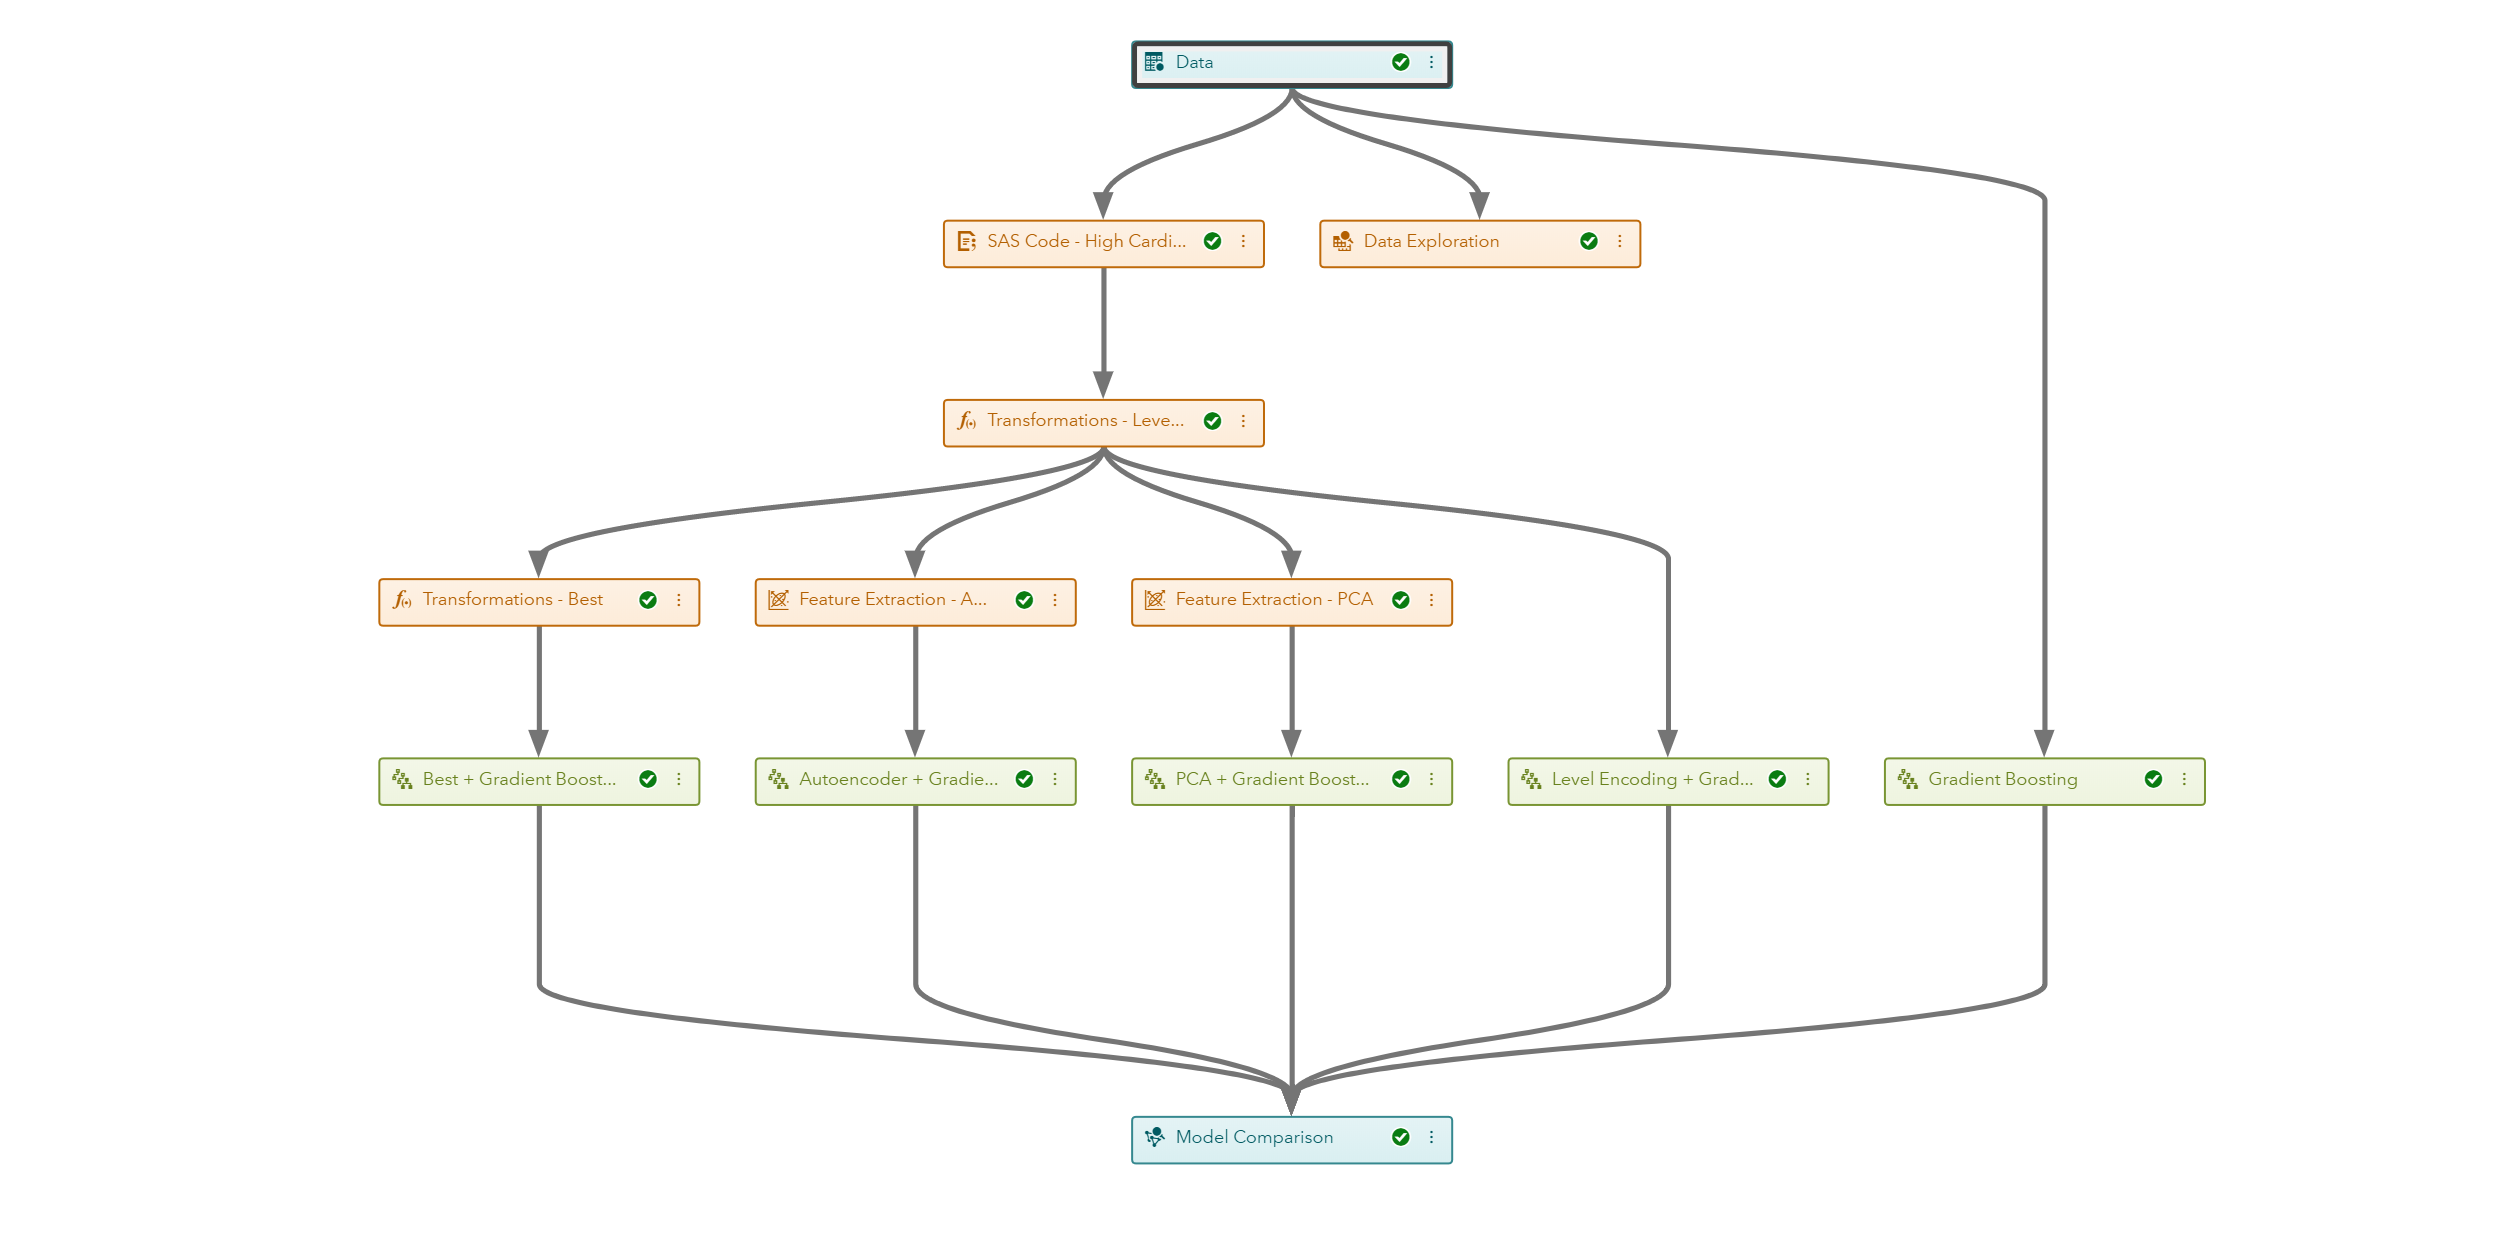
In the trial, we’ll show you how SAS Visual Data Mining and Machine Learning makes building models faster and easier using pre-built templates. Want to include feature engineering in your data mining but don’t know where to start or what techniques to use? It’s easy. With SAS you’ll simply add a feature engineering template to your project. The results will let you know what techniques you should consider when thinking about data mining pre-processing. You might uncover results from our speed dating data that indicate feature engineering would be constructive.
After you've explored the model building features of this trial, the experience ends with deploying your champion model and showing how to score data. This means you'll experience the entire analytics lifecycle from data to discovery to deployment without leaving the trial environment.
If you're ready to use the power of SAS to solve one of life’s biggest questions and if you want to be the hero that holds the key – for all your single friends – to the secret behind love at first sight, don’t wait, get signed up. It’s FREE!
Oh, and don’t forget to add an entry in our GitHub challenge and get recognition for your modeling expertise.
Sign up to explore the speed dating data today