Forget about Big Volume, for my money the real value in Big Data comes from its variety. Why? Because just as there is “Value in the Network” when it comes to your business ecosystem, your data can be "networked" for value in much the same way.
Before we dive into the business implications of Big Variety, consider this case from the natural sciences – the discovery, development and eventual acceptance of plate tectonics. First proposed as the theory of Continental Drift by Alfred Wegener in 1912, it was not until the 1960’s that it was fully accepted based on the overwhelming data-driven evidence acquired across a wide variety of fields:
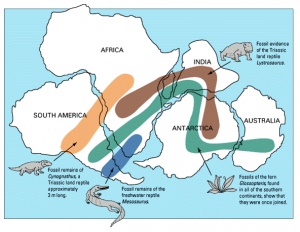 Geography – As early as 1596 the Dutch cartographer Abraham Ortelius noted the remarkable fit of the South American and African continents, and even suggested that “the Americas were torn away from Europe and Africa . . . by earthquakes and floods”.
- Geology – In direct support of his theory, Wegener remarked that the locations of several unusual geologic structures could be found on matching coastlines of South America and Africa.
- Paleontology - Snider-Pellegrini noted that the locations of certain fossil plants and animals on present-day, widely separated continents would form definite patterns (shown by the bands of colors on the above map). Wegener further highlighted the discovery of fossils of tropical plants (in the form of coal deposits) in Antarctica led to the conclusion that this frozen land previously must have been situated closer to the equator. Other mismatches of geology and climate included the occurrence of glacial deposits in present-day arid Africa.
- Bathygraphy – Not only did post-WW II sonar reveal the extent of the Mid-Atlantic ridge circling the planet under the ocean surface, detailed analysis of the data indicated a narrow gorge precisely along the center crest of the mountain range where the plates were separating.
- Oceanography – Seafloor mapping using magnetic instruments revealed a pattern of alternating magnetic striping on either side of the mid-ocean ridge.
- Seismology - Earthquake-recording instruments enabled scientists to learn that earthquakes tend to be concentrated in along the oceanic trenches and spreading ridges.

It took putting all this data from these disparate fields together to develop a plausible mechanism for what came to be known as plate tectonics and thus finally vindicating Wegener. Big Variety preceded Big Volume by half a century.
Getting back to the application of Big Variety to the business environment, let’s start with what’s commonly called the networking problem. Connecting two people requires one connection. Connecting three people require three connections, four people requires six, five requires ten, twelve requires 66, 100 requires 4950, and so on. As you would expect, there is a formula for this, the Triangular Number formula: (N(N-1))/2.
 One more formula: N!/(K!(N-K)!). Combinations. How many different combinations of three can I make from a set of five? That would be ten, where N=5 and K=3 in the above formula. From a set of ten the number of combinations of three jumps to 120. Combinations of four, instead of just three, from that same set of ten is nearly double that: 210. And if I have a set of 100 to choose from instead of just ten, then my combinations of four becomes an incredible 3,921,225! (whew, that got out of hand fast …)
Is this a problem? Or an opportunity?
Sorry – rhetorical question – IT’S AN OPPORTUNITY! It’s an opportunity for insight, unparalleled insight into your business.
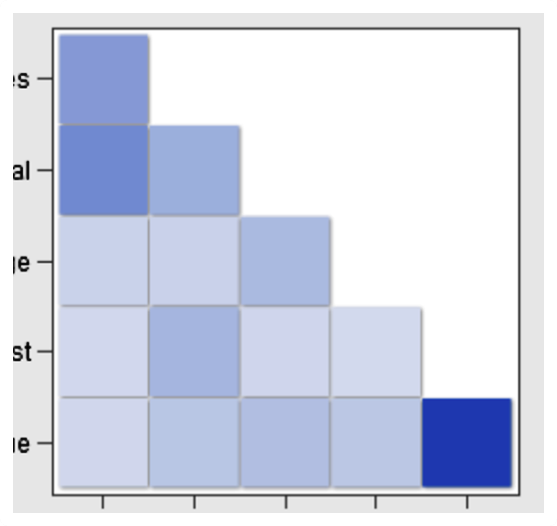
Let me walk you through a generalized example of exactly how easily and quickly SAS Visual Analytics allows you to draw insights from your Big Variety. The place to start would be with a Correlation Matrix (above), a pairwise evaluation of attributes which displays the degree of correlation between measures as a series of colored rectangles. The color of each rectangle indicates the strength of the correlation, with the dark blue in this example representing strong correlation.
This simple matrix where N=6 and K=2 has 15 pairwise combinations – a typical functional or departmental analysis of your business, say for customer service or production or logistics, might have 20 elements for analysis, yielding 190 pairwise combinations, covering maybe a decade’s worth of data and millions or even hundreds of millions of rows, which would be processed by SAS Visual Analytics in just a few seconds.
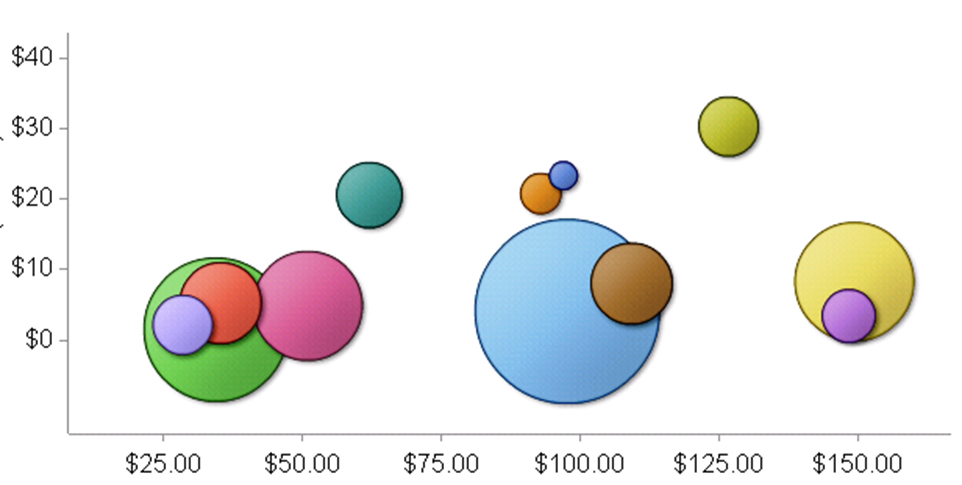 You then might grab the two pairwise elements highlighted in that dark blue box in the bottom right, say perhaps 'failure rates' and 'time since last maintenance', throw in 'facility', 'equipment type' and 'year', and take a look at what a bubble plot might reveal, where the axes, color and size all represent different attributes, and which can be set in motion over time.
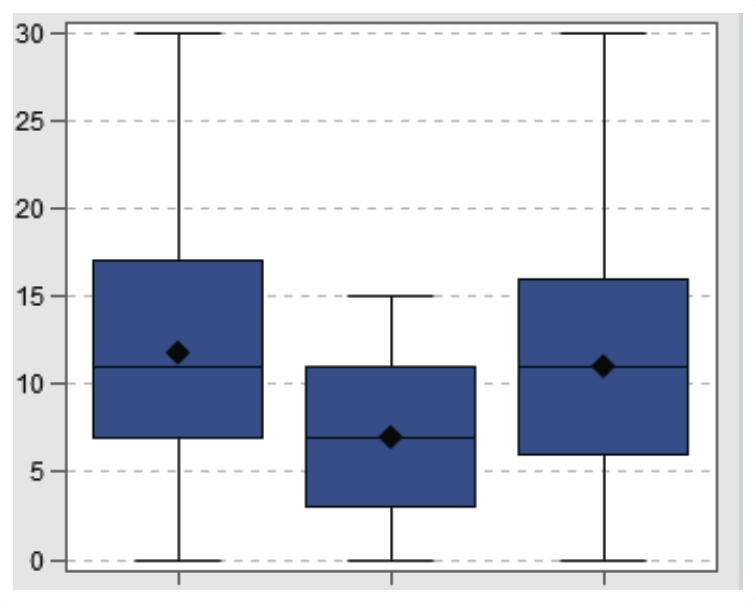 Lastly, once you’ve narrowed down your suspect list to perhaps three categories of high failure equipment, a box plot might be useful to compare typical failure rates, with the box representing the 25th to the 75th percentiles, and the whisker bars showing the extreme outliers.
If the data is available, that entire process would take only a couple of minutes. And these are just three illustrative examples of hundreds of exploratory techniques and analytical tools available in SAS Visual Analytics. Rinse and repeat for thousands of possible insights for action across your organization: Marketing, Sales, Customer Service, Quality, Distribution, Human Resources, Innovation, Procurement, and of course, Operations.
The value from data integration and networking multiplies exponentially with each additional data source. Big Variety is the future of Big Data.

5 Comments
Leo - great article! Very interesting how you took a complex, rarely discussed scientific event and related it to every day, common business challenges. Whole-heartedly agree the value of variety over volume when it comes to Big Data analysis. (On a side note, I did a research presentation on Wegener and his Tectonic Plate Shifting Theory in college, and have been fascinated by his discovery every since!!). I plan to incorporate your example into my customer discussions to illustrate the value of variety in Big Data analytics. Well done!
Pingback: Painting with big data analytics - Value Alley
Pingback: UN Comtrade - Global Manufacturing - Visual Analytics
Pingback: Good habits for big data - Value Alley
For those interested in BIG data, particularly large-scale correlation analysis, using SAS Viya, see:
https://communities.sas.com/t5/SAS-Communities-Library/Large-scale-correlation-analysis-with-the-hyperGroup-CAS-Action/ta-p/612126