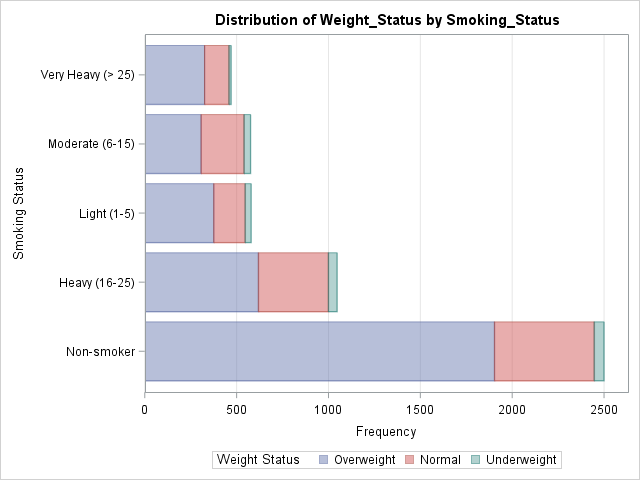
Let PROC FREQ create graphs of your two-way tables

The recent releases of SAS 9.4 have featured major enhancements to the ODS statistical graphics procedures such as PROC SGPLOT. In fact, PROC SGPLOT (and the underlying Graph Template Language (GTL)) are so versatile and powerful that you might forget to consider whether you can create a graph automatically by