
Using RStudio with SAS Viya

Getting started with SAS Viya and RStudio -- making the connection, and submitting my first commands via CAS actions.
Getting started with SAS Viya and RStudio -- making the connection, and submitting my first commands via CAS actions.

One thing that inspires me is hearing two super minds who are thought leaders in their fields discussing new ways to make our planet better. This happened recently when I listened to an episode of Mark Hyman’s Doctor’s Farmacy Podcast where Dr. Hyman was interviewing environmentalist Miriam Horn. Miriam Horn
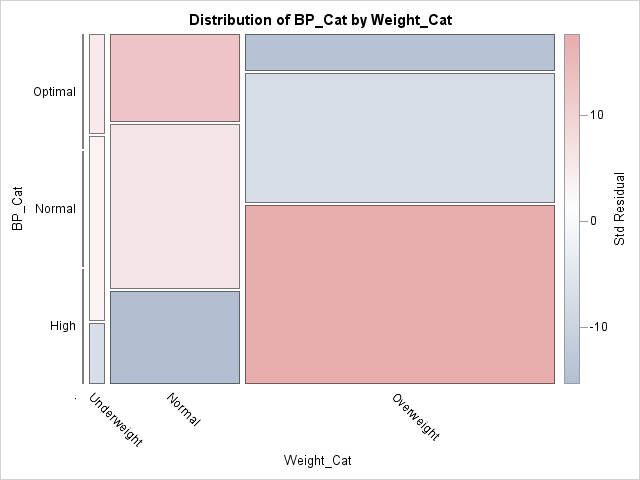
Back in SAS 9.3M2 (SAS/STAT 12.1), PROC FREQ introduced mosaic plots to visualize the joint frequencies in a contingency table. By default, the cells in a mosaic plot are colored according to levels of one of the categorical variables in the analysis. However, in 2013 I showed how you can

