I recently joined SAS in a brand new role: I'm a Developer Advocate. My job is to help SAS customers who want to access the power of SAS from within other applications, or who might want to build their own applications that leverage SAS analytics. For my first contribution, I decided to write an article about a quick task that would interest developers and that isn't already heavily documented. So was born this novice's experience in using R (and RStudio) with SAS Viya. This writing will chronicle my journey from the planning stages, all the way to running commands from RStudio on the data stored in SAS Viya. This is just the beginning; we will discuss at the end where I should go next.
Why use SAS Viya with R?
From the start, I asked myself, "What's the use case here? Why would anyone want to do this?" After a bit of research discussion with my SAS colleagues, the answer became clear. R is a popular programming language used by data scientists, developers, and analysts – even within organizations that also use SAS. However, R has some well-known limitations when working with big data, and our SAS customers are often challenged to combine the work of a diverse set of tools into a well-governed analytics lifecycle. Combining the developers' familiarity of R programming with the power and flexibility of SAS Viya for data storage, analytical processing, and governance, this seemed like a perfect exercise. For this purpose of this scenario, think of SAS Viya as the platform and the Cloud Analytics Server (CAS) is where all the data is stored and processed.
How I got started with SAS Viya
I did not want to start with the task of deploying my own SAS Viya environment. This is a non-trivial activity, and not something an analyst would tackle, so the major pre-req here is you'll need access to an existing SAS Viya setup. Fortunately for me, here at SAS we have preconfigured SAS Viya environments available on a private cloud that we can use for demos and testing. So, SAS Viya is my server-side environment. Beyond that, a client is all I needed. I used a generic Windows machine and got busy loading some software.
What documentation did I use/follow?
I started with the official SAS documentation: Getting Started with SAS Viya for R. I'll won't detail the step-by-step from there, but I'll walk through the process and highlight any pitfalls.
I also referred to the github repository for R-SWAT installation, which can be found at SAS Scripting Wrapper for Analytics Transfer (SWAT) for R.
The Process
The first two things I installed were R and RStudio, which I found at these locations:
https://cran.r-project.org/
https://www.rstudio.com/products/rstudio/download/
The installs were uneventful, so I'll won't list all those steps here. Next, I installed a couple of pre-req R packages and attempted to install the SAS Scripting Wrapper for Analytics Transfer (SWAT) package for R. Think of SWAT as what allows R and SAS to work together. In an R command line, I entered the following commands:
> install.packages('httr') > install.packages('jsonlite') > install.packages('https://github.com/sassoftware/R-swat/releases/download/v1.2.1/R-swat-1.2.1-> linux64.tar.gz', repos=NULL, type='file') |
When attempting the last command, I hit an error:
… ERROR: dependency 'dplyr' is not available for package 'swat' * removing 'C:/Program Files/R/R-3.5.1/library/swat' In R CMD INSTALL Warning message: In install.packages("https://github.com/sassoftware/R-swat/releases/download/v1.2.1/R-swat-1.2.1-linux64.tar.gz", : installation of package 'C:/Users/sas/AppData/Local/Temp/2/RtmpEXUAuC/downloaded_packages/R-swat-1.2.1-linux64.tar.gz' had non-zero exit status |
The install failed. Based on the error message, it turns out I had forgotten to install another R package:
> install.packages("dplyr") |
(This dependency is documented in the R SWAT documentation, but I missed it. Since this could happen to anyone – right? – I decided to come clean here. Perhaps you'll learn from my misstep.)
After installing the dplyr package in the R session, I reran the swat install and was happy to hit a return code of zero. Success!
For the brevity of this post, I decided to not configure an authentication file and will be required to pass user credentials when making connections. I will configure authinfo in a follow-up post.
Testing my RStudio->SAS Viya connection
From RStudio, I ran the following command to connect to the CAS server:
> library(swat) > conn <- CAS("mycas.company.com", 8777, protocol='http', user='user', password='password') |
Now that I succeeded in connecting my R client to the CAS server, I was ready to load data and start making API calls.
How did I decide on a use case?
I'm in the process of moving houses, so I decided to find a data set on property values in the area to do some basic analysis, to see if I was getting a good deal. I did a quick google search and downloaded a .csv from a local government site. At this point, I was all set up, connected, and had data. All I needed now was to run some CAS Actions from RStudio.
CAS actions are commands that you submit through RStudio to tell the CAS server to 'do' something. One or more objects are returned to the client -- for example, a collection of data frames. CAS actions are organized into action sets and are invoked via APIs. You can find a list of actions and action sets in the SAS documentation.
Next, I moved my table data (in a semi-colon delimited csv file) from my client to the CAS server:
> citydata <- cas.read.csv(conn, "C:\Users\sas\Downloads\property.csv", sep=';') NOTE: Cloud Analytic Services made the uploaded file available as table PROPERTY in caslib CASUSER(user). |
What analysis did I perform?
I purposefully kept my analysis brief, as I just wanted to make sure that I could connect, run a few commands, and get results back.
Here is a brief series of CAS action commands that I ran from RStudio:
Get the mean value of a variable:
> cas.mean(citydata$TotalSaleValue) Column Mean 1 TotalSaleValue 343806.5 |
Get the standard deviation of a variable:
> cas.sd(citydata$TotalSaleValue) Column Std 1 TotalSaleValue 185992.9 |
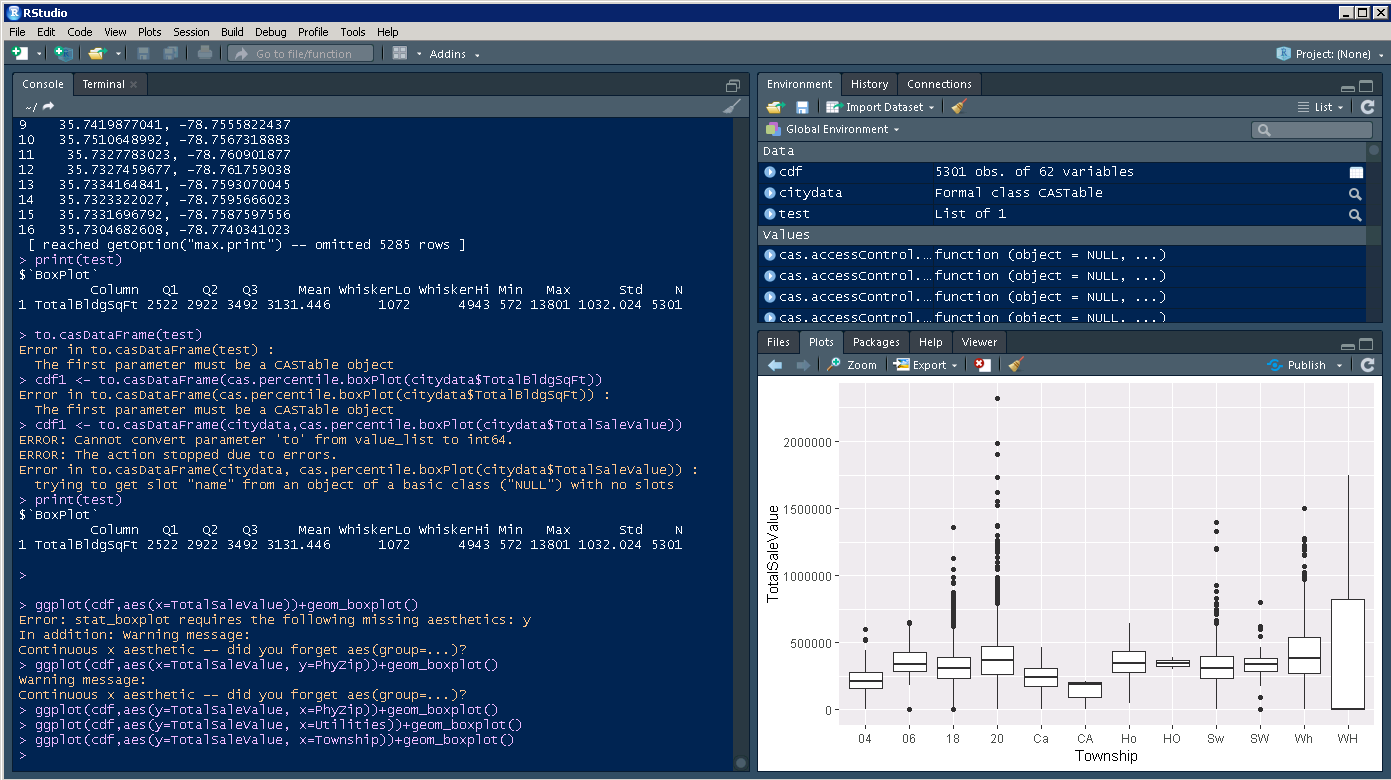
Get boxplot data for a variable:
> cas.percentile.boxPlot(citydata$TotalSaleValue) $`BoxPlot` Column Q1 Q2 Q3 Mean WhiskerLo WhiskerHi Min Max Std N 1 TotalSaleValue 239000 320000 418000 343806.5 0 685000 0 2318000 185992.9 5301 |
Get boxplot data for another variable:
> cas.percentile.boxPlot(citydata$TotalBldgSqFt) $`BoxPlot` Column Q1 Q2 Q3 Mean WhiskerLo WhiskerHi Min Max Std N 1 TotalBldgSqFt 2522 2922 3492 3131.446 1072 4943 572 13801 1032.024 5301 |
Did I succeed?
I think so. Let's say the house I want is 3,000 square feet and costs $258,000. As you can see in the box plot data, I'm getting a good deal. The house size is in the second quartile, while the house cost falls in the first quartile. Yes, this is not the most in depth statistical analysis, but I'll get more into that in a future article.
What's next?
This activity has really sparked my interest to learn more and I will continue to expand my analysis, attempt more complex statistical procedures and create graphs. A follow up blog is already in the works. If this article has piqued your interest in the subject, I'd like to ask you: What would you like to see next? Please comment and I will turn my focus to those topics for a future post.
See Also
Want to learn more about using R with SAS Viya? Check out the new book by SAS developers Kevin Smith, Yue Qi, and Xiangxiang Meng: SAS Viya: The R Perspective.

5 Comments
Great article
Hi Sundaresh,
SAS Viya is certainly set up for asynchronous processing. Your question specifically addresses client-side calls from Python. How you would make calls to the CAS would depend on your Python code or application. I found this article on aync communication with Python: https://www.aeracode.org/2018/02/19/python-async-simplified/. I would assume that the same kind of functionality would be available for R. In both cases, requests could be sent to SAS Viya for the heavy processing and your application/program could continue to run in the meantime. You may want to refer to my colleague Deva Kumar’s paper on restAF from the 2018 SAS Global Forum: https://www.sas.com/content/dam/SAS/support/en/sas-global-forum-proceedings/2018/1882-2018.pdf. Deva discusses how to use the JavaScript library that is specifically crafted to make API calls.
Hi Joe
Thanks for this great article. I am not an R user, but I have played around with the Python wrapper and calling the Rest APIs from a web page using JS. Since you mention API calls, I am curious to find out whether it is possible to make asynchronous calls (like in Java script) or parallel calls to CAS from the client?. Since the Viya machine in most cases might have more processing than the R client, will this be an opportunity to parcel out some work to CAS, do something else in R in the meantime ( not depending on CAS) and then use results when they come back?
Great post. Heard someone say at a conference that SAS has progressed through the 7 Stages of Grief regarding open source (R, python, etc.). Posts like this make it clear that this is true. Great to see how Viya will make "The Power of SAS" accessible from many different languages / interfaces.
Hi Quentin,
Thanks for reading and the feedback. SAS has had a presence in open source for a while now. At the same time, we realize the need for further promote these capabilities. I'll be working on additional articles in this area. Stay tuned.