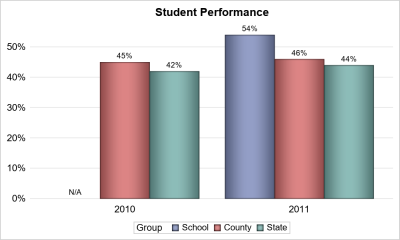
Recently a colleague was requested to create a bar chart showing the performance of students in a school compared to county and state wide schools. The solution using SGPLOT was simple as shown below. /*--Create data--*/ data school; input Year Group $ Value; format Value percent5.1; datalines;

English
Custom bar labels
Get-Togethers: Thinking outside of the box
Not long ago I read this New York Times article on The Power of Positive People. After reading about the unsurprising benefits of having a constant support group, I was inspired to think of how I could create opportunities for people in my social circle to get together and support
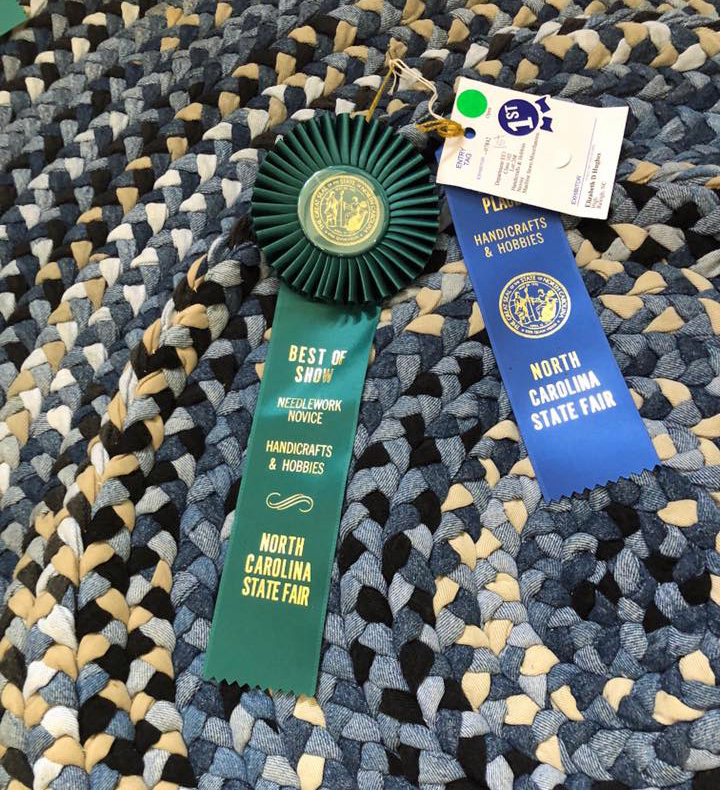
We broke some records at the 2018 NC State Fair!
This past Sunday was the last day of the NC State Fair, and we broke some records this year! Can you guess what those records were? I'll ramble on about the fair to give you time to come up with your guess, and then I'll let you know about the