This past Sunday was the last day of the NC State Fair, and we broke some records this year! Can you guess what those records were? I'll ramble on about the fair to give you time to come up with your guess, and then I'll let you know about the record-numbers at the bottom of the blog post...
The State Fair is just a couple miles down the road from SAS Headquarters (and my house) - close enough that I can hear the fireworks every night at 9:45pm! And, of course, I get to drive through the 'crazy' fair traffic (a lot of people that visit the fair aren't familiar with the roads, so of course they're not quite sure what lanes to be in, etc). Therefore I definitely notice when it's "fair time."
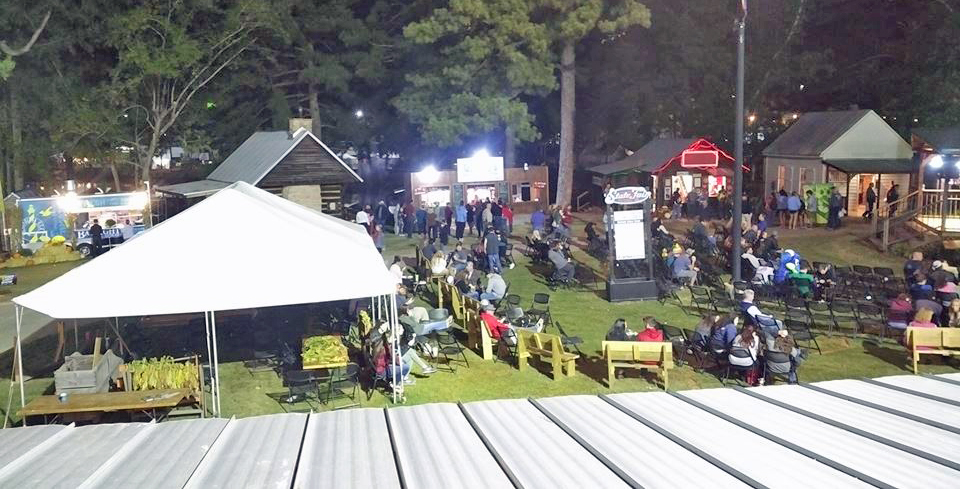
NC State University is a couple of miles on the other side of the fairgrounds, and I worked at the fair for a couple of years when I was a student - yep, I was a 'carny'! My friend Annie worked there this year, providing information at the tobacco display. Here's a picture she sent me, of the more laid-back section of the State Fair.
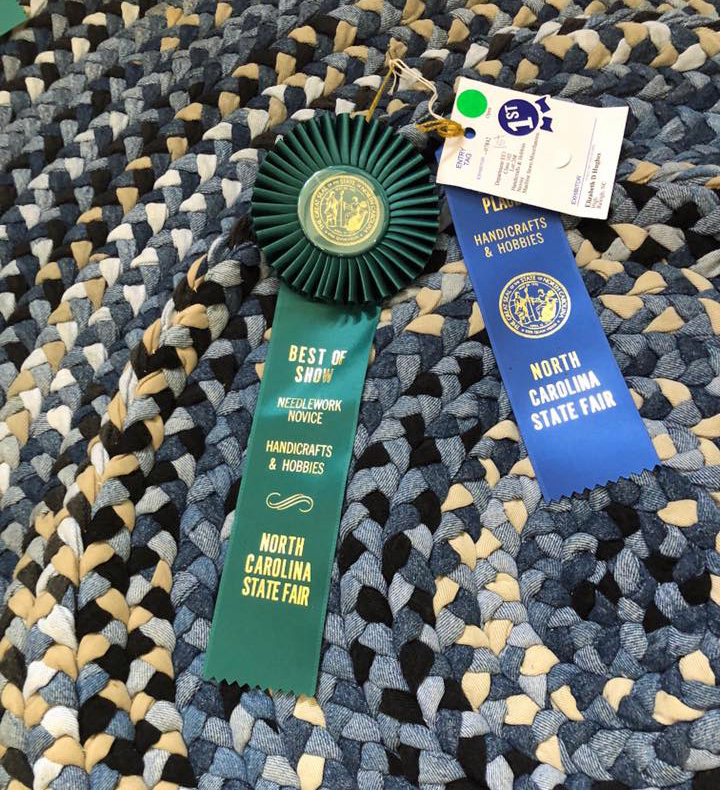
My friend Beth has become very 'crafty' now that she's in the over-30 age group. Her latest project was a rug made from braided strips of recycled blue jean material. I predicted that the color of the rug would go well with the blue ribbon she'd win. She not only won the blue ribbon in her category, but also won a "best of show" ribbon!
Breaking Records
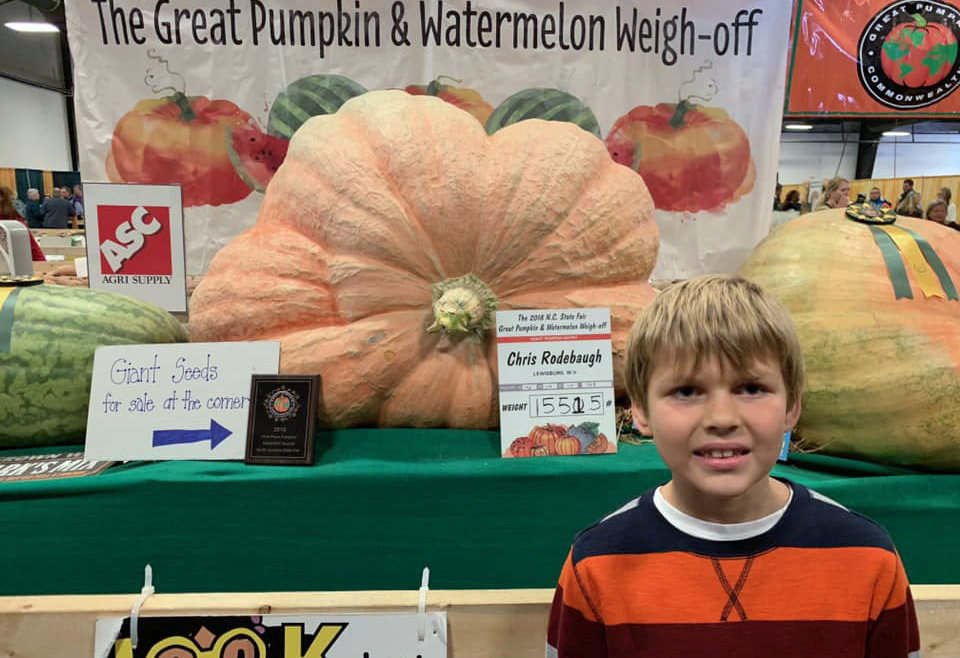
But enough about tobacco & textiles ... let's get to a couple of those records! This year, two pieces of produce shattered previous records. There was a 1,551.5 pound pumpkin (beating the 2017 record of 1,458.5 pounds), and a 327.5 pound watermelon (beating the 2017 record of 316 pounds)! Here's an article, with more details and pictures. How many pumpkin pies could you make from a 1,551.5 pound pumpkin? (leave your guesses in the comments section) Here's a picture of my friend Sandra's son with the record-breaking pumpkin:
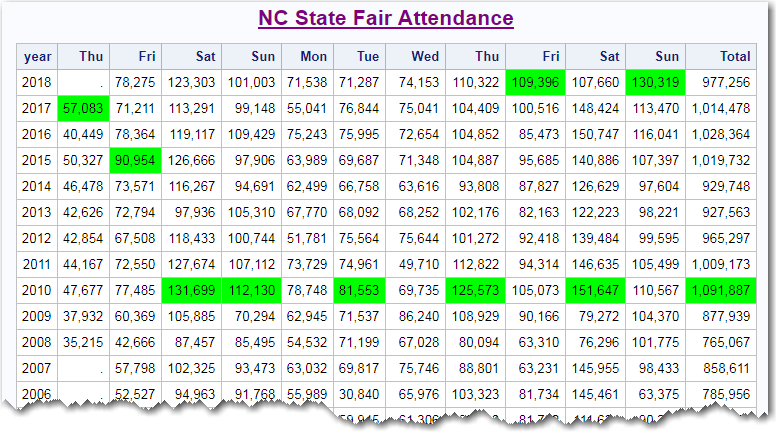
And since I'm a data guy, how about a record with a lot of data ... let's have a look at State Fair attendance. Thankfully the fair provides a web page with daily attendance data since 1986. Here's a screen-capture of their attendance table - it's a long table, and I've done a bit of 'trickery' to show the column headers at the top, along with the most recent data at the bottom (I chopped out the middle years of the table, so you can see it in a smaller space):
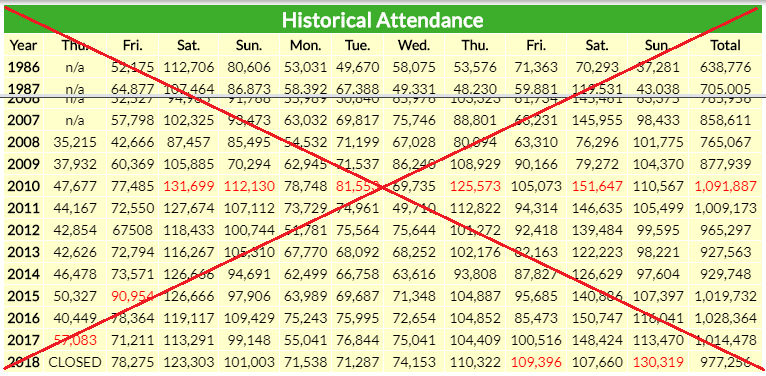
In their table, they've highlighted the record attendance days in red. I like that they've highlighted these days, but the red is a little difficult to see against the yellow background. Also, some people associate the color red with 'bad' - and I don't think they want to show the high attendance as a bad thing ... quite the opposite! Therefore I imported the data into SAS, and tried my hand at creating a new/improved table.
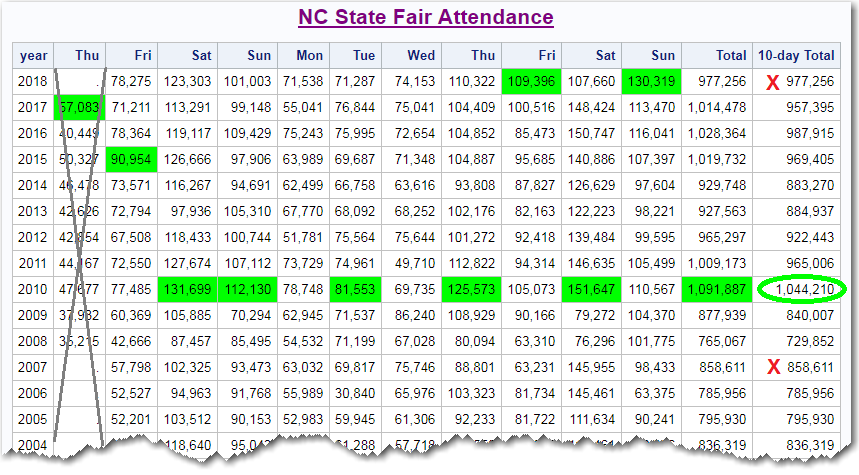
In my table, I sorted the rows so the most recent years are at the top, because that's the data users are most likely to be interested in. It also places the most recent data close to the column headers, so you don't have to scroll up/down to see which number goes with which day. And I highlighted the record attendance days with a bright green background, rather than making the text red. I think these small changes make the table much easier to read. Now it's easy to see that we set attendance records for Friday & Sunday of the last weekend of the fair this year!
You might be wondering about that 'missing value' for the first Thursday in 2018 ... The fair was actually closed that day, as they recovered from Hurricane Michael. Being down for one day, we didn't break the total attendance record this year, however one news release mentioned that 2018 set a 10-day attendance record - but I say "it depends on how you calculate that number." It was the highest 10-day attendance total of years that only had 10 days of attendance (beating the previous record of 858,611 set in 2007) ... but if you calculate the 10-day attendance subset (first Friday through 2nd Sunday) of every year (including the years that also had 11 days of attendance), 2010 had a higher 10-day total than 2018. See the extra column I added to the right edge in the table below:
As much as I like a good table, I think I'm still going cross-eyed trying to take in all the numbers from the attendance table. And if I want to keep the title "Graph Guy" I think I am expected to create a graph of this data! The graph below lets you get a good general feel for all the data in the table, in one quick glance.
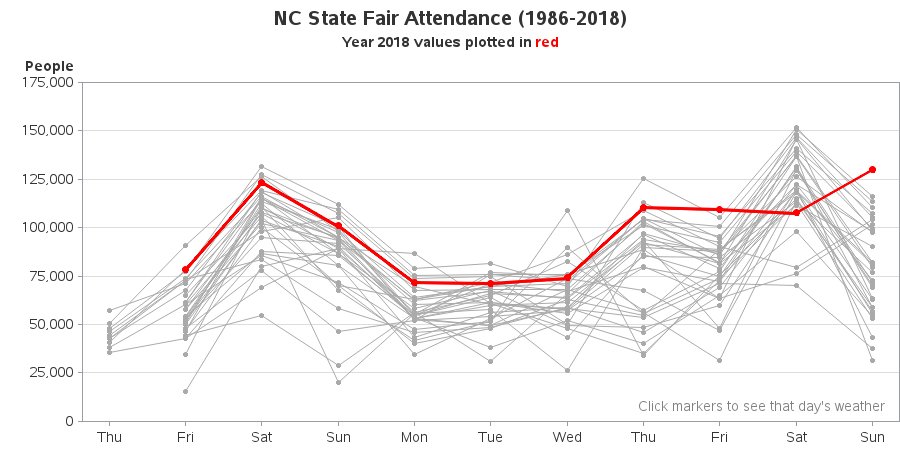
You can see an odd-looking divergence in the lines for the 2nd Thursday (attendance on the 2nd Thursday greatly increased, after they started offering free admission on that day for people who made donations to the canned food drive). And also the red line (2018 attendance) was noticeably lower than most previous years on the 2nd Saturday - that's probably because it was a somewhat cloudy/rainy day, as shown in my friend David's picture below (thanks Dave!)

Did you go to the NC State Fair? - What was favorite thing about it? (leave a comment below)
