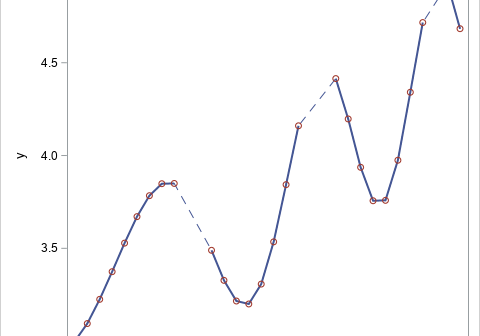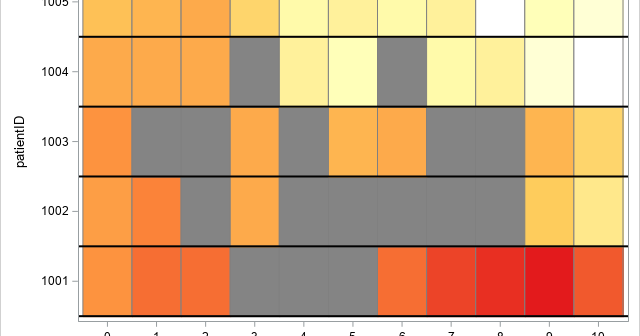
Longitudinal data are measurements for a set of subjects at multiple points in time. Also called "panel data" or "repeated measures data," this kind of data is common in clinical trials in which patients are tracked over time. Recently, a SAS programmer asked how to visualize missing values in a

