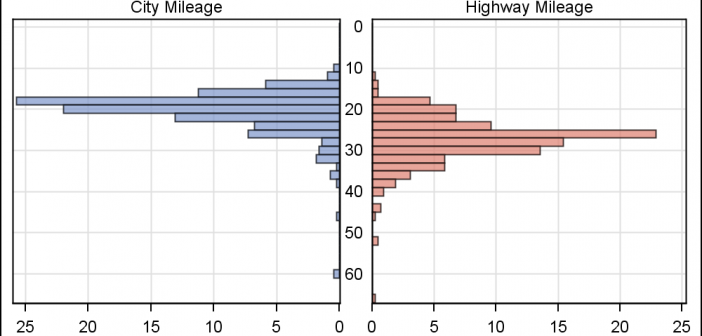
In reference to a previous article on Violin Plots, a reader asked about creating comparative mirrored histograms to compare propensity scores. While I had my own understanding of "Mirrored Histograms", I also looked this up on the web. Google showed many cases of two histograms back to back, either horizontally or vertically.
Tag: SGPLOT procedure
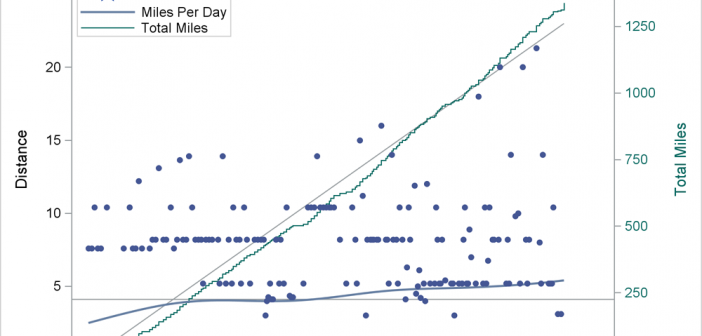
I decided this year to get serious about my running. I started recording my distance for every run. I made a SAS data set and generated simple reports. After a few weeks, I set a goal of averaging one marathon a week (3.8 miles per day, 26.2 miles per week,
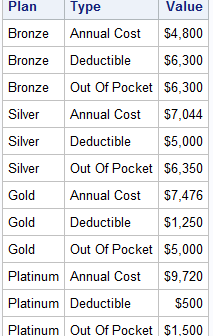
Working at SAS, I consider myself fortunate to have the best employee benefits in the industry. That is one of the factors placing SAS as one of the best companies to work for worldwide, and often THE best company to work for in USA. Given that, I was curious to know the kind
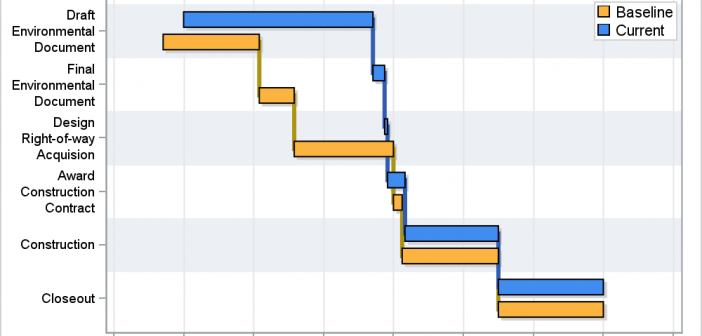
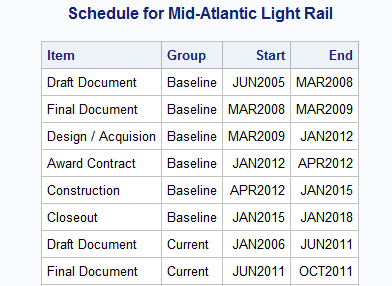
A couple of weeks back I described q way to create a Schedule Chart using the SGPLOT procedure. In that case, I used the HIGHLOW plot to draw bar segments, both for a single and grouped case. A natural extension is to create one with links between each segment. So,
Last week Bruno asked about creating a Schedule Chart using SG Procedures. To me, such projects are very interesting and challenging...How much mileage can we get out of the current set of SGPLOT procedure features to create a visual that was not part of the original requirements? The clear choice for
A couple of weeks back we had a question on how to make a bar chart with stacked and clustered groups. User also wanted to display the value for each stacked segment below the bars. The article Bar Charts with Stacked and Cluster Groups shows how to create such a
Recently, SAS released SAS Solutions OnDemand for academics. An academic user who is signed up for this can use the SAS Web Editor application to do all their data analysis over the web using a hosted server at SAS. This frees up the user from having to install the software on their own computers,
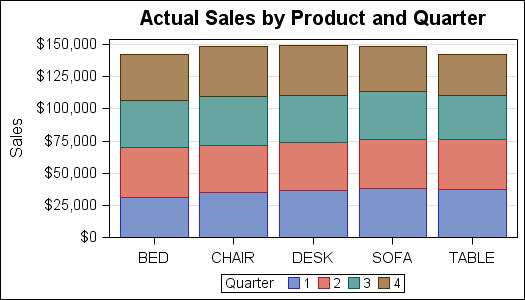
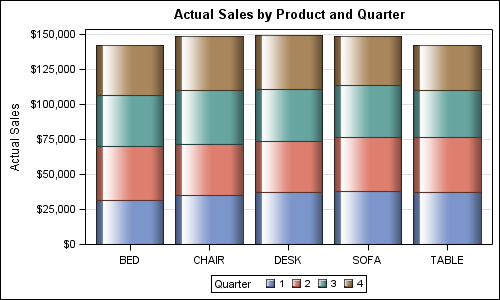
Creating bar charts with group classification is very easy using the SG procedures. When using a group variable, the group values for each category are stacked by default. Using the sashelp.prdsale data set and default STAT of SUM, here is the graph and the code. SGPLOT code: proc sgplot data=sashelp.prdsale;
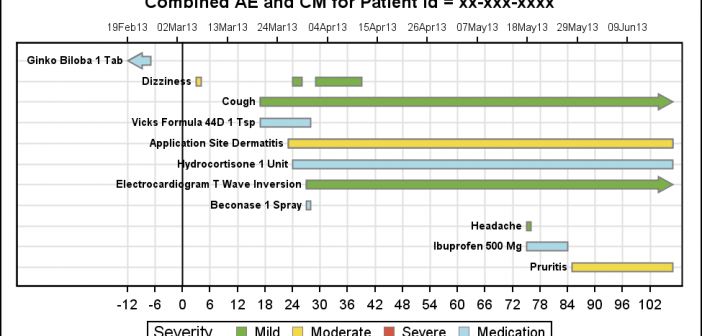
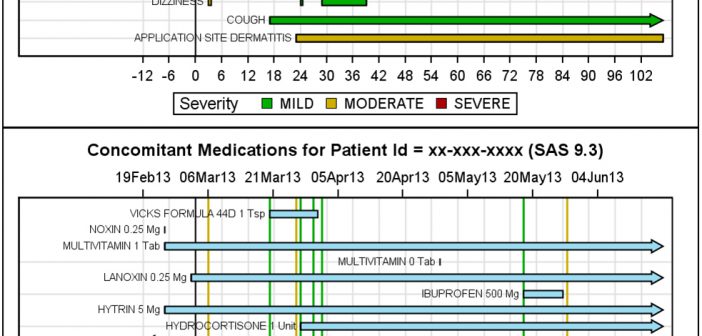
As promised, here is a better combined AE-CM graph, using some of the UI improvements suggested by our UI expert, Riley. His suggestions helped to reduce the clutter in the graph, while still keeping all the features preferred by our users. Click on the graphs for a higher resolution image.
At the SAS Global Forum 2013 in San Francisco, I presented a paper on making Patient Profile Graphs using SAS. You can follow the link to see the graphs presented in this paper. In that paper, I presented ways to create AE, CM, VS and Lab graphs. I discussed aligning the