Tag: Getting Started with SGPLOT

The SGPLOT procedure creates one or more plots and overlays them on a single set of axes. You can use the SGPLOT procedure to create statistical graphics such as histograms and regression plots, in addition to simple graphics such as scatter plots and line plots. Statements and options enable you to control the appearance of your graph and add additional features such as legends and reference lines.

Getting started with SGPLOT? You’ve come to the right place.
Data Visualization
Sanjay Matange 1
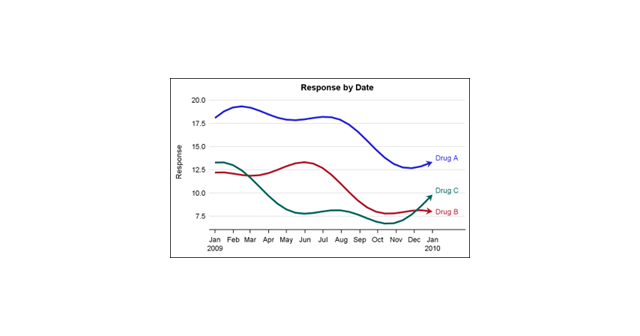
Getting Started with SGPLOT - Part 4 - Series Plot

This is the 4th installment of the Getting Started series.  The audience is the user who is new to the SG Procedures.  Experienced users may also find some useful nuggets of information here. Series plots are frequently used to visualize a numeric response on the y-axis by another numeric variable on

Data Visualization
Sanjay Matange 6
Visual Index

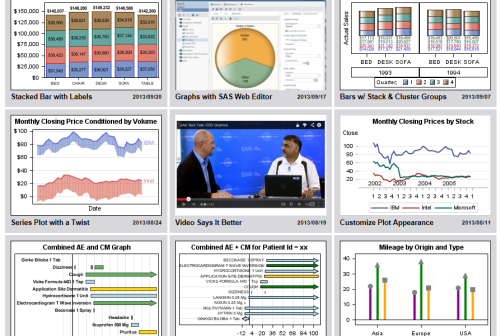
Some of you may have already noticed the small graphical icon on the lower right side of the blog article labeled "Graphically Speaking Index".   Yes, it is a link to a visual index for all articles published in this blog.  Well, eventually it will have all the articles. So far, I

Back to Top