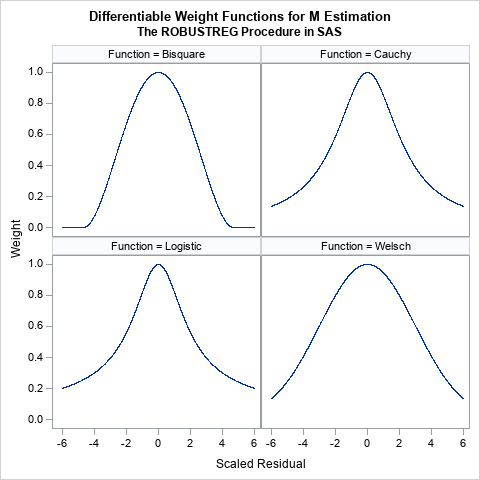
Uncategorized

Analytics
Chuck Ellstrom 0
The Two E's

Unless you’ve been living under a rock, you’ve heard about the budget problems running rampant across all levels of government. Federal, State and Local Governments are all facing historic budget shortfalls due to the economic crisis and decreased tax receipts. This has led to a much closer examination of services

Rick Wicklin 0
Funnel plots: An alternative to ranking

In a previous blog post, I showed how you can use simulation to construct confidence intervals for ranks. This idea (from a paper by E. Marshall and D. Spiegelhalter), enables you to display a graph that compares the performance of several institutions, where "institutions" can mean schools, companies, airlines, or

Learn SAS
Sandy Varner 0
The Power of the Backlist

In today’s changing environment the hype seems to focus on new, updated, latest release, newly developed, cutting edge and so on. With so many new SAS books to choose from, I thought it might be interesting to take a look at our most popular backlist titles (books that were published

Rick Wicklin 0
A statistical model of card shuffling

I recently returned from a five-day conference in Las Vegas. On the way there, I finally had time to read a classic statistical paper: Bayer and Diaconis (1992) describes how many shuffles are needed to randomize a deck of cards. Their famous result that it takes seven shuffles to randomize

SAS Events
Mike Kalt 0
What Didn't Stay in Vegas

Just flew back from Vegas, and boy, are my arms tired! (ba-dump) If you attended SAS Global Forum, you probably learned a lot of things you didn't know. But if you were a SAS employee, you also learned a lot of things you didn't know. One of the perks of

Analytics
0
Getting to the point of return on analytics

Linking business analytics to economic value is a hard problem. Despite all the smarts that get poured into models, it's hard to tie them to financial measures such as profitability. And, because of that, it's hard to justify investment in analytics. Need headcount? Sorry, try again. Need tools? Sorry, can't

Rick Wicklin 0
The sound of the Dow...in SAS

At the beginning of 2011, I heard about the Dow Piano, which was created by CNNMoney.com. The Dow Piano visualizes the performance of the Dow Jones industrial average in 2010 with a line plot, but also adds an auditory component. As Bård Edlund, Art Director at CNNMoney.com, said, The daily

Rick Wicklin 0
Computing the variance of each column of a matrix

In a previous blog post about computing confidence intervals for rankings, I inadvertently used the VAR function in SAS/IML 9.22, without providing equivalent functionality for those readers who are running an earlier version of SAS/IML software. (Thanks to Eric for pointing this out.) If you are using a version of

Rick Wicklin 0
How to rank values

When comparing scores from different subjects, it is often useful to rank the subjects. A rank is the order of a subject when the associated score is listed in ascending order. I've written a few articles about the importance of including confidence intervals when you display rankings, but I haven't

SAS Events
Michele Reister 0
What happens in Las Vegas...

…will come home with you. This week, as many of you know, SAS Global Forum is taking place in Las Vegas. Many of our SAS Training Instructors are there teaching classes, presenting papers, hosting workshops and answering your questions in the Demo Hall. We hope the knowledge you learn at

Rick Wicklin 0
How to sample from independent normal distributions

In my article on computing confidence intervals for rankings, I had to generate p random vectors that each contained N random numbers. Each vector was generated from normal distribution with different parameters. This post compares two different ways to generate p vectors that are sampled from independent normal distributions. Sampling

SAS Events
Chris Hemedinger 0
SAS programmers: meet Twitter

"Twitter, thou art nought but data." So sayeth the SAS programmer. Many data analysts now recognize Twitter for what it is: a tremendous source of data covering almost any topic, from Justin Bieber's hair to political uprisings to technical conferences to company brands. SAS offers sophisticated solutions to harness this

1 252 253 254 255 256 281