All Posts


You’ve read their books. You’ve probably even met them at conferences. But now, we’re revealing another side of our beloved SAS authors in this list of fun facts. Prepare to be surprised. Hint – one of the authors swims with sharks. Tricia Aanderud Tricia has over 100 jokes memorized -


With Big Data, there are far more technical questions than answers.


Pink and blue. These colors are often synonymous with gender. In fact, when I was pregnant 16 years ago, we had no idea of our baby’s sex. At the shower, we received lots of blue, green and yellow clothing, but no pink. It’s interesting how blue can represent both male

All axis customization features are always welcome. Especially since SGPLOT statements can often be used to create non standard graphs, having the ability to customize the axes is important. This article presents ways in which you can customize the discrete axes. By default, the x axis will try to display the
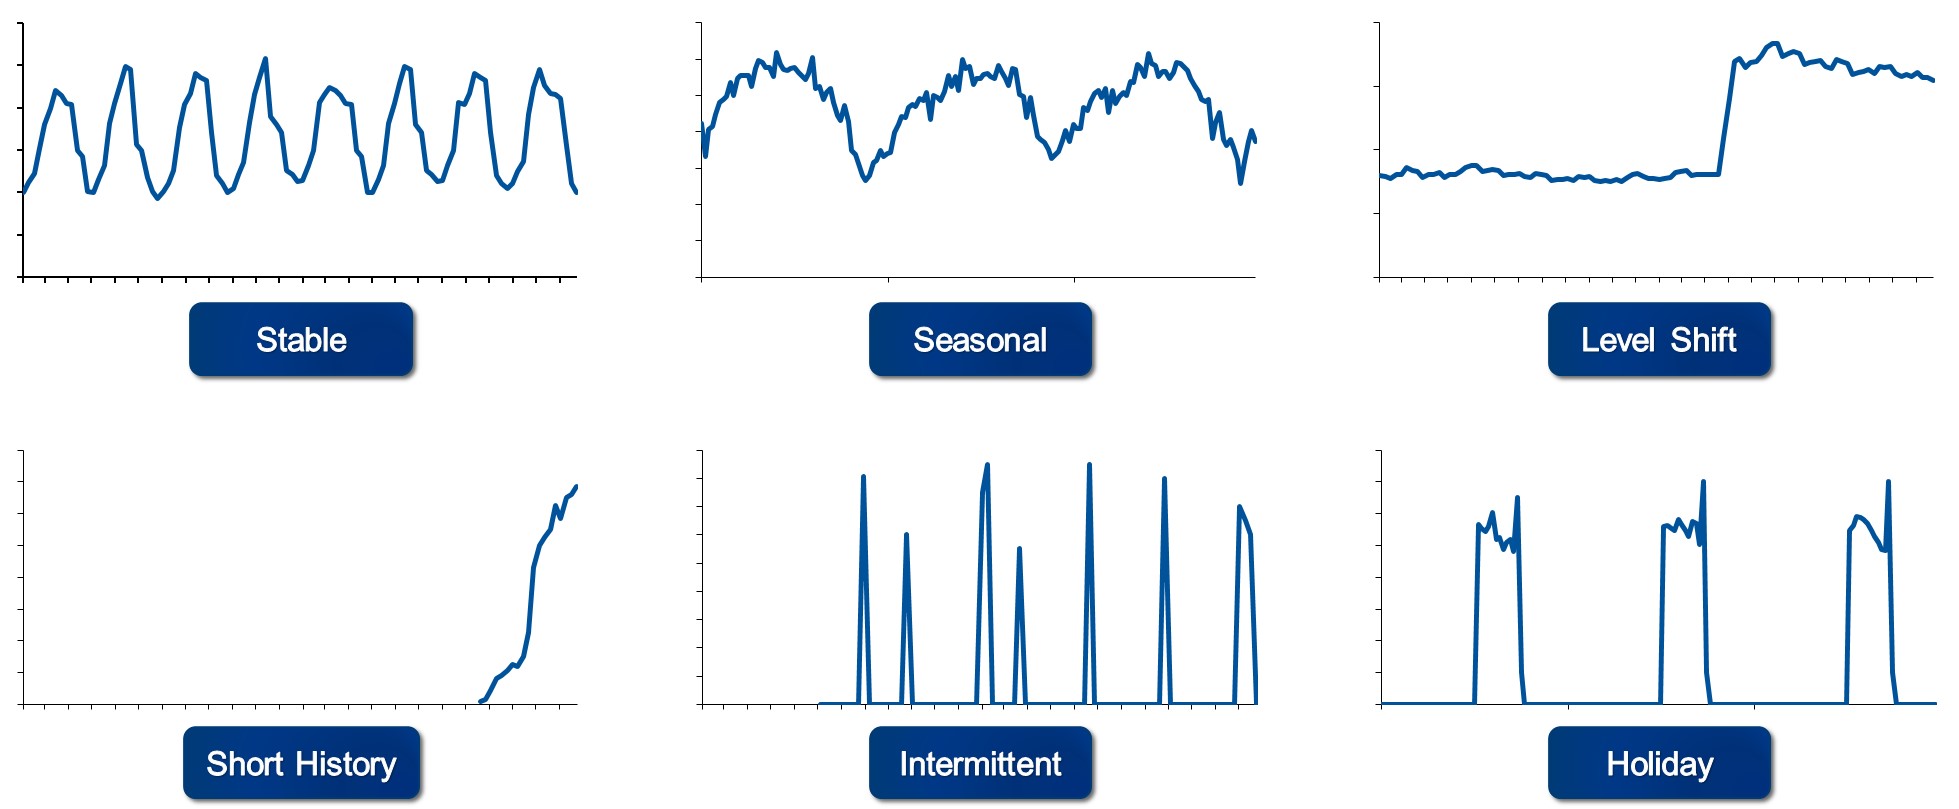

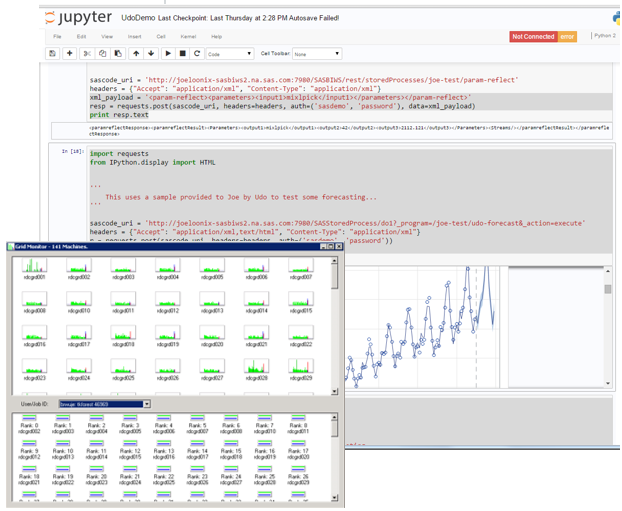
ビジネスに使える「良い予測結果」を得るために 今回は、8月にリリースされたSAS Forecast Serverの新しい機能を紹介しながら、データが理想どおりに画一的にはなっていない実際のビジネスの現場で「良い予測結果」を得るために必要な3つの要素についてご紹介します。 はじめに 需要予測はもともと、天候などの不確実なばらつきをもつ外的要因という制約のもとで、顧客満足度や販売機会を最大化(欠品による損失の最小化)しつつ、売れ残りや在庫保有といったコストを最小限にするための手段のひとつです。生産から販売までのリードタイムが長い商品の販売量の予測や、一定期間先の需要量の取引を行うエネルギーの売買に携わる企業にとっては、正確な需要予測が不可欠です。今回は、予測結果そのものの精度をビジネス上の課題解決に見合う精度にするために、欠かせない要素ついてご紹介します。 欠かせない三つの工夫 SASは長年、SAS/ETSやSAS Forecast Serverなど、時系列予測機能を提供してきましたが、それらツールを使用して実際に成果を出している企業に共通するのは、これらのツールに用意されている時系列予測アルゴリズムを単に使用するのではなく、精度を高めるためのなんらかの"工夫"をしているということです。それをまとめると以下の3つに集約されます。 予測対象の実績データ(以下、時系列データ)のセグメンテーション マルチステージ(他段階の)予測モデリング 予測結果の追跡 予測のためのアルゴリズムは世の中に多数存在しますが、それを単純に適用するだけでは、ビジネス上の意思決定に利用可能な精度を実現するのは実は困難です。従来は、上記3つの工夫をシステム構築の際に考慮し独自に仕組みを作りこむ必要がありました。SASはこれらをベストプラクティス化し、ツールそのものの機能としてリリースしました。新たにSAS Forecast Serverに備わった、それら3つの機能について簡単にご紹介します。 1.時系列データのセグメンテーション どの店舗でいつ何が売れるのかを予測しなければいけない小売業 客室の埋まり方を予測しなければならないホテル業 顧客満足度を落とさずに欠品率をコントロールするために、どの施設レベルで予測すべきかに頭を悩ませる流通業 エネルギーの使用量を予測しなければならないデータセンター事業者やエネルギー供給企業 乗客数や交通量を予測する航空関連企業 コールセンターの需要を予測して従業員の配置を計画する通信会社 など、どのような予測業務においても、最初のステップは、自社の時系列データがどのようになっているかを理解することです。 理想的な時系列データ 従来の予測技術にとって最も完璧な(うれしい)時系列データはこのような形(図1)をしています。量が多く、データ期間が長く、安定していて、同じパターンが繰り返され、欠損値がほとんどなくパターンが予測しやすいという特徴があります。 このような理想的な時系列データが仮に存在したとすれば、自動化された予測エンジンと単一の予測モデリング戦略で簡単に良い予測結果が得られます。 実世界の時系列データ しかし現実世界では、企業が保有する時系列データはもっと多様です(図2)。 洗剤のようにいつでも売れる安定した(Stable)需要 バーベキューセットのように季節性(Seasonal)のある需要 あるいはレベルシフト(Level Shift)があるような需要-例えば、市場や販売チャネルを拡大したタイミングなど- 新製品の投入や新市場への進出など、データ期間が非常に限定されている(Short History)。 自動車の特定の補修部品のようにスパースなデータ(あるいは間歇需要とも言います)(Intemittent)。 ハロウィングッズのように一年に一回のある週や月しか売れないものもあります(Holiday)。 このようにそれぞれまったく異なる時系列パターンに対して単一の予測モデリング戦略を適用しても良い予測結果は得られません。これらにどのように対処するかが「良い予測結果」を得られるかどうかの分かれ道になります。 時系列データのセグメンテーション この問いに対する解決策は、時系列データのセグメンテーションです。時系列データのセグメンテーションとは、時系列データのパターンに応じて異なるパターンに分類する方法です。これは、需要予測プロセスにおいて最も重要な最初のステップのひとつです。分類した後にそれぞれのパターンに応じた予測モデリング戦略を適用することが「良い予測結果」を得るための秘訣となります。 これにより、 Stableなデータに対しては、ロバストなARIMAモデルを適用し、 季節性を示すデータには季節性モデルを、 Level Shiftタイプにはレベルシフトの要素を説明変数に利用できるARIMAX手法を、 新製品パターンには類似性分析のテクニックを用い、 スパースなデータに対しては間歇需要のための予測モデルを、 Holidayパターンにはカスタマイズした時間間隔モデルを使用する


No one knows for sure who coined the term Big Data. Despite etymological studies, we are still no closer to attributing provenance to any one person, or indeed any one period. Some say the term was coined in the '80s, others believe the '90s – and many are convinced the term originated


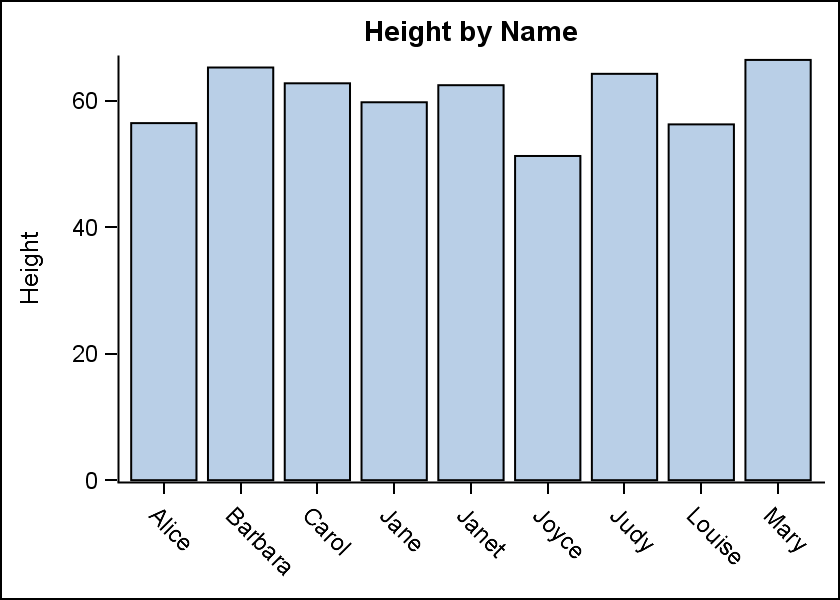
A coworker was recently in need of some simple graphics to include in a slide show to accompany her SAS Global Forum paper. After listening to what she wanted, I decided that I could use PROC SGPLOT to create those images for her. The first image was a set of stacked
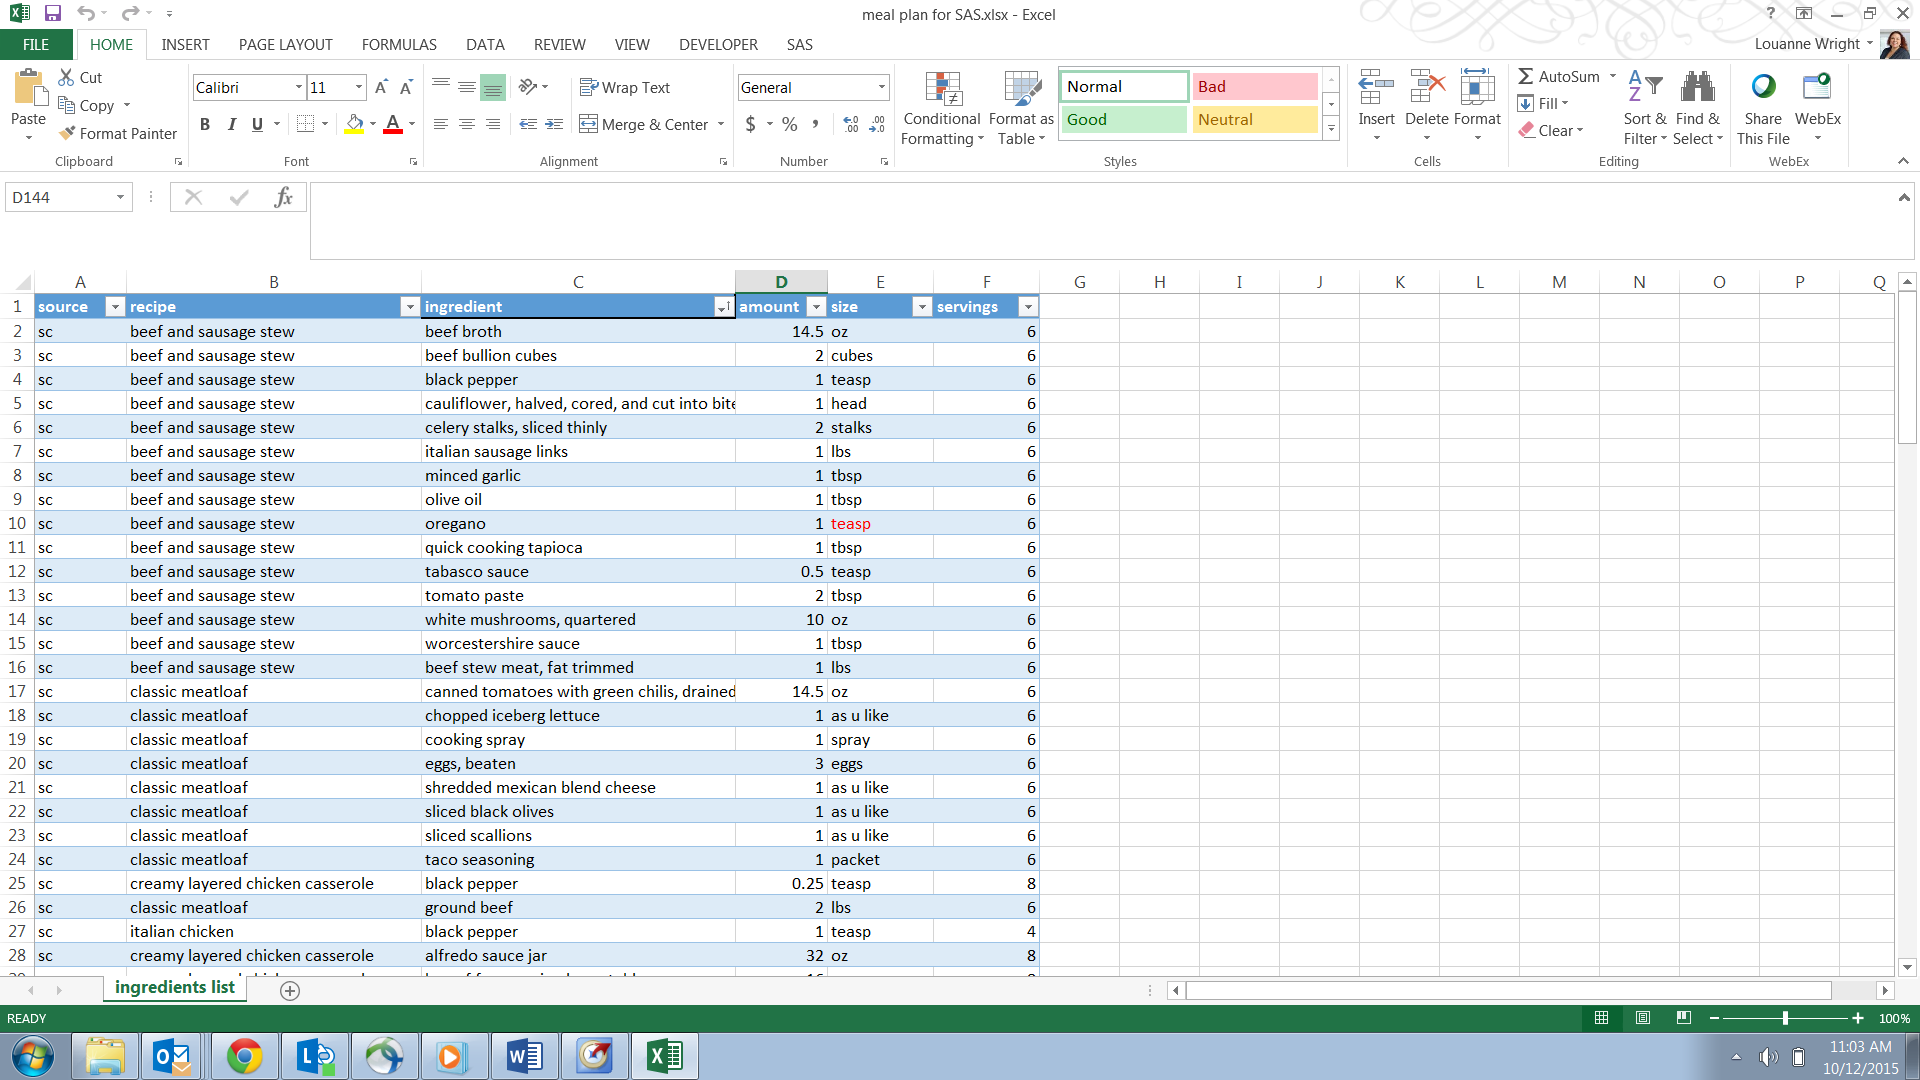

Creating a grocery shopping list can be overwhelming for a variety of reasons. Lack of experience, picky eaters, and new recipes can turn an ambitious cook into an overwhelmed procrastinator. In this blog post I’ll show you an easy SAS Enterprise Guide project that uses prompts to create a simple
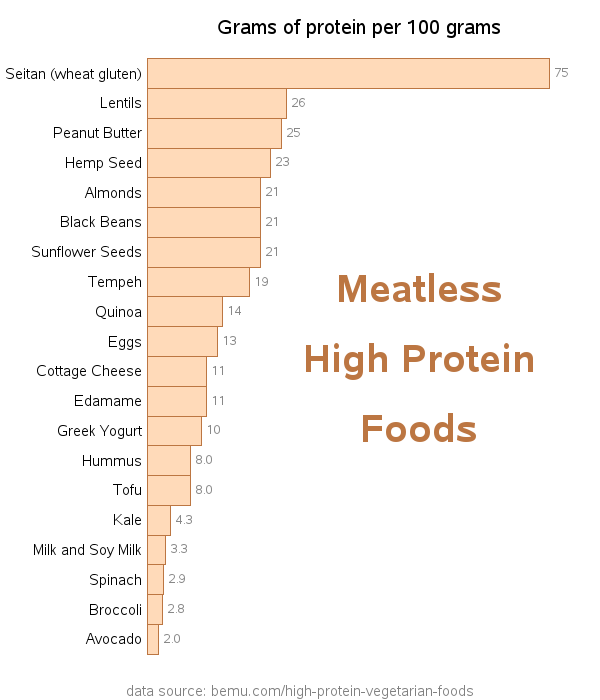

More and more of my friends seem to be eating less and less meat, for various reasons (such as religious, health, social conscience, weight loss, personal preference, cost savings, etc). So I thought I would put together a graph to help them find alternate sources of protein. While searching for


In today’s brave new technological world, most of us live cocooned in thermo-regulated cars and buildings. Our food and drink is on tap, and we experience little inconvenience beyond death and taxes. It’s easy to forget that life as we know it would come to an abrupt halt without the


Jim Harris discusses perspectives on the question of how much quality big data really needs.


Sizing is a topic that solutions managers typically leave until the end after decisions about the application have been settled. But there are often many variables that can impact the final size requirement. We have seen across our customer base that sizing and the number of environments has been determined

Have you been in your attic lately? Or maybe cleaned out that closet that all of your “stuff” seems to gravitate to? Sure, mostly you’ll just find old junk that is no longer useful or purely nostalgic, but every once in a while you come across those long lost treasures


In a previous post, I discussed using discrete-event simulation to validate an optimization model and its underlying assumptions. A similar approach can be used to validate queueing models as well. And when it is found that the assumptions required for a queueing model are not a good fit for the


Editor’s Note: Regular registration for SCSUG 2015 closes on October 19th, though on-site registration will be available on conference days. Can’t make this year’s conference? Proceedings from previous conferences are currently available. Presentations from 2015 will become available shortly after the conference. For most people, the day before Halloween means