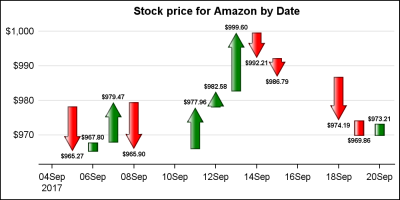
This is the 7th installment of the Getting Started series. The audience is the user who is new to the SG Procedures. Experienced users may also find some useful nuggets of information here. Starting with SAS 9.3 which was released 6 years ago, the SGPLOT procedure supports many new plot types including
Tag: HighLow Plot
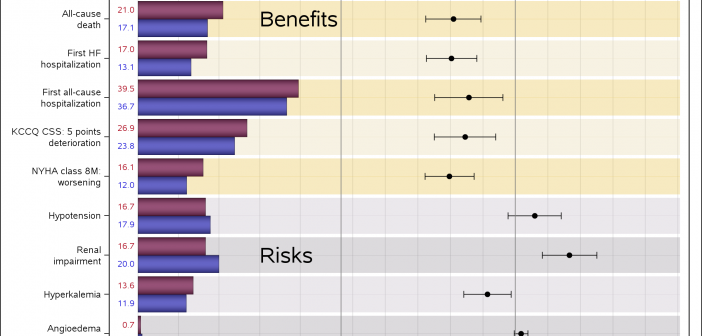
Often I have written articles that are motivated by some question by a user on how to create a particular graph, or how to work around some shortcoming in the feature set to create the graph you need. This time, I got a question about Clinical Graphs that were mostly working
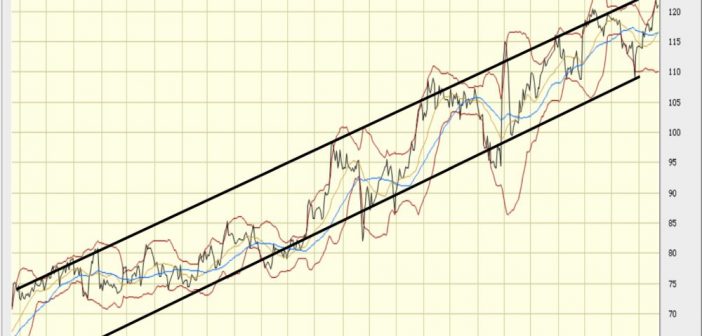
This weekend I was reviewing my portfolio of stocks as usual. Yes, I do have a small stock portfolio with a few stocks, and normally I use free stock charting software to review the stock plots. These sites allow you to view the daily stock prices along with many technical
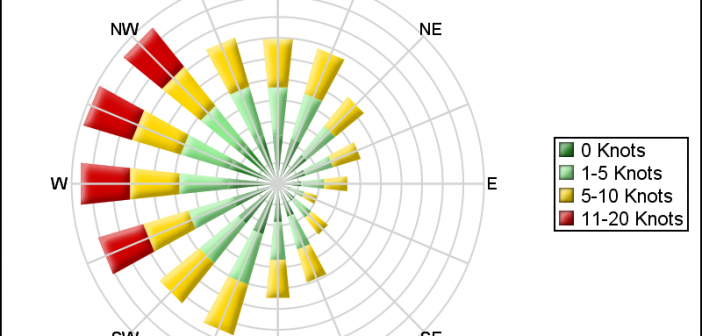
Last week I posted an article on displaying polar graph using SAS. When the measured data (R, Theta) are in the polar coordinates as radius and angle, then this data can be easily transformed into the XY space using the simple transform shown below. x=r*cos(theta * PI / 180); y=r*sin(theta * PI
A HighLow plot is very popular in the financial industry, often used to track the periodic movement of a stock or some instrument or commodity. The CandleStick Chart is one specific type of high low plot, purportedly originating in Japan for tracking of financial instruments in the rice trade. Creating a
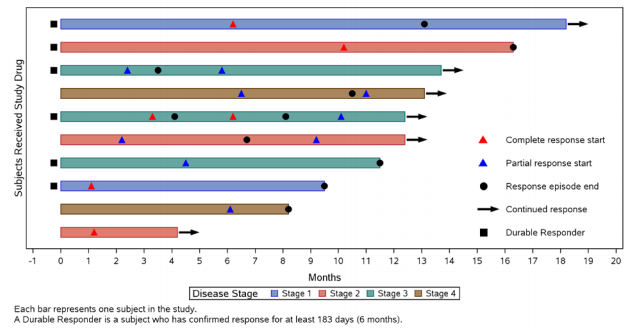
At PharmaSUG 2014 in San Diego, I had the pleasure of attending "Swimmer Plot: Tell a Graphical Story of Your Time to Response Data Using PROC SGPLOT", by Stacey Phillips. In this paper, Stacey presented an interesting graph showing the effects of a study drug on patients' tumor size. Stacey
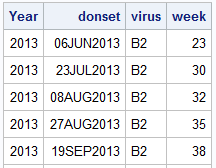
Recently, a user posed a question on how to plot stacked frequencies on a time axis. The data included frequencies of different viruses by week. The data is modified to preserve confidentiality and is shown below. The user's first instinct was to use a bar chart with stacked groups. This works for automatically computing frequencies
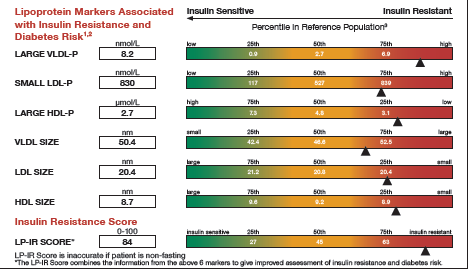
It was almost two weeks ago that I got started making a display for lab tests for a subject, based on a graph I saw on the web for an article on this blog. This graph is a part of a larger panel display of the lab values for a
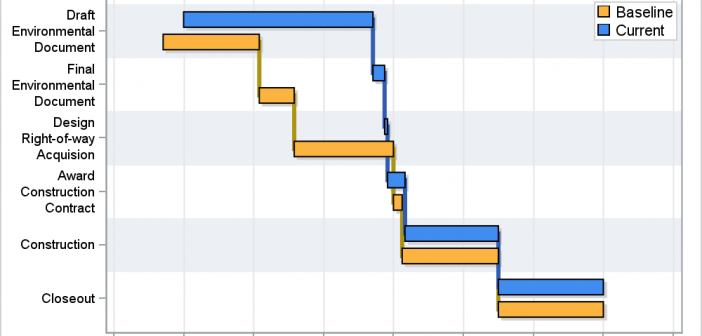
A couple of weeks back I described q way to create a Schedule Chart using the SGPLOT procedure. In that case, I used the HIGHLOW plot to draw bar segments, both for a single and grouped case. A natural extension is to create one with links between each segment. So,
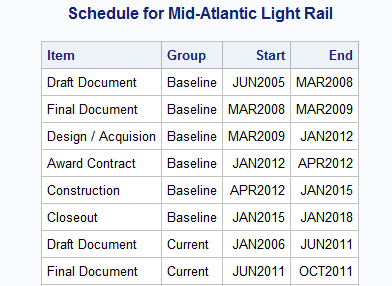
Last week Bruno asked about creating a Schedule Chart using SG Procedures. To me, such projects are very interesting and challenging...How much mileage can we get out of the current set of SGPLOT procedure features to create a visual that was not part of the original requirements? The clear choice for