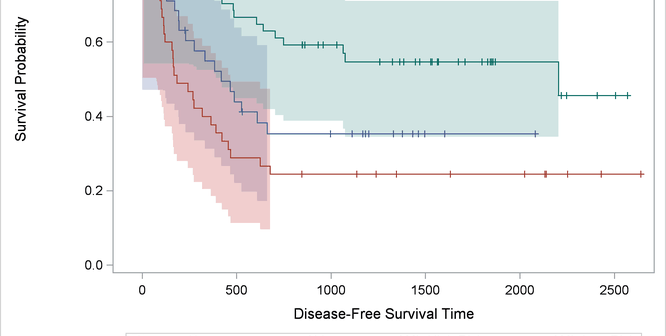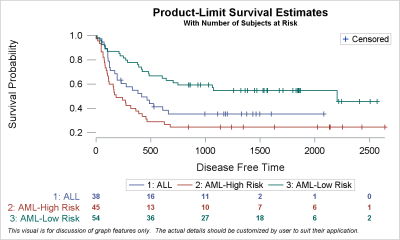
Survival plots are automatically created by the LIFETEST procedure. These graphs are most often customized to fit the needs of SAS users. One way to create the customized survival plot is to save the generated data from the LIFETEST procedure, and then use the SGPLOT procedure to create your custom
Tag: Clinical Graphs
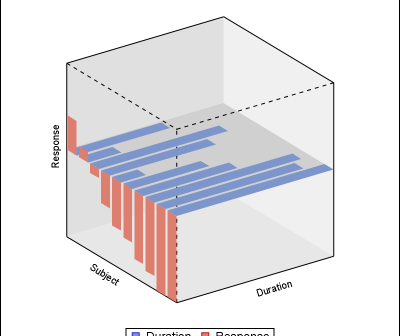
A few months ago, a user inquired about a chart that showed tumor response and treatment duration for each subject on 2 different planes of a 3D view. The data was really 2D, with one independent variable (the subject id) and two or more response values. I had provided an
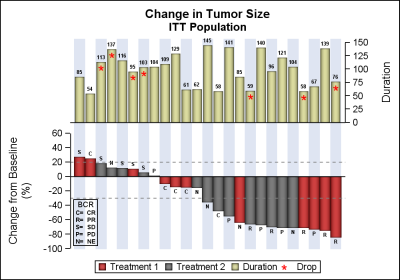
Waterfall plots have gained in popularity as a means to visualize the change in tumor size for subjects in a study. The graph displays the reduction in tumor size in ascending order with the subjects with the most reduction on the right. Each subject is represented by a bar classified by
Customizing the Kaplan-Meier plot in assorted ways is so popular that we devote an entire chapter to it in the SAS/STAT documentation.
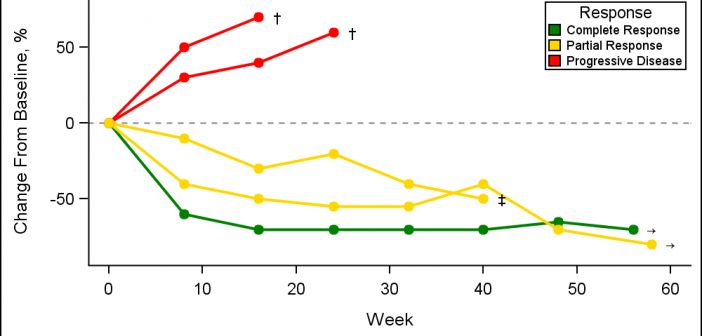
A Spider Plot is another way of presenting the Change from Baseline for tumors for each subject in a study by week. The plot can be classified by response and stage. Another way of displaying Tumor Response data was discussed earlier in the article on Swimmer Plot. This article is prompted
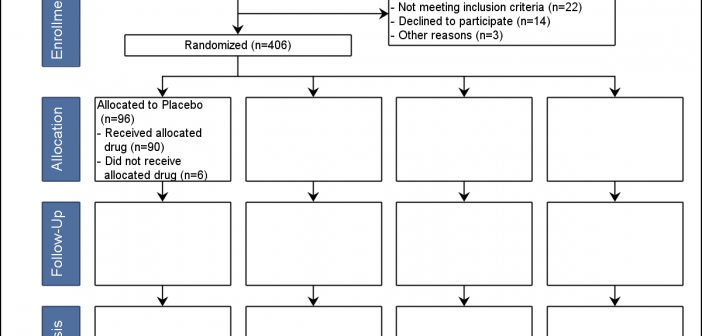
Over the past few weeks I have heard about the "Consort Diagram". This was mentioned in a Communities article, and also by a couple of users separately. This topic was also covered by Anusha Mallavarapu and Dean Shults from Cytel in a poster at PhUSE 2016 as shown on the
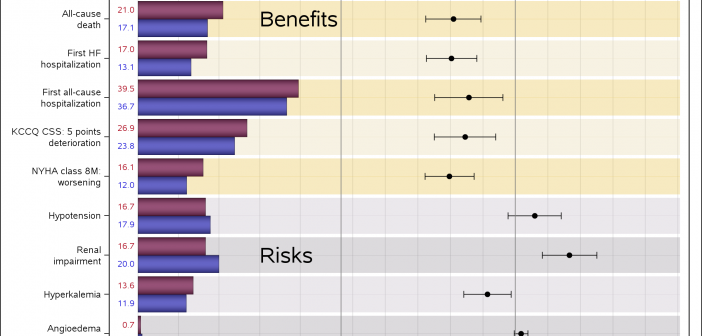
Often I have written articles that are motivated by some question by a user on how to create a particular graph, or how to work around some shortcoming in the feature set to create the graph you need. This time, I got a question about Clinical Graphs that were mostly working
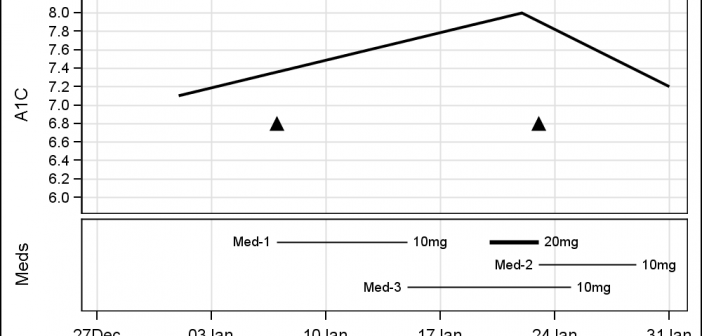
Last week I was visiting San Diego for the SANDS conference. I always enjoy this conference as I get to interact closely with the users to hear of their pains and innovative solutions to creating Clinical Graphs. In the conference Ed Barber asked about displaying A1c data along with some
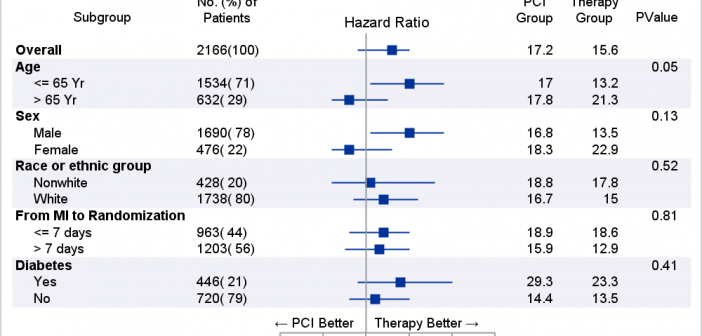
The advent of the AXISTABLE statement with SAS 9.4, has made it considerably easier to create graphs that include statistics aligned with x-axis values (Survival Plot) or with the y-axis (Forest Plot). This statement was specifically designed to address such needs, and includes the options needed to control the text attributes of
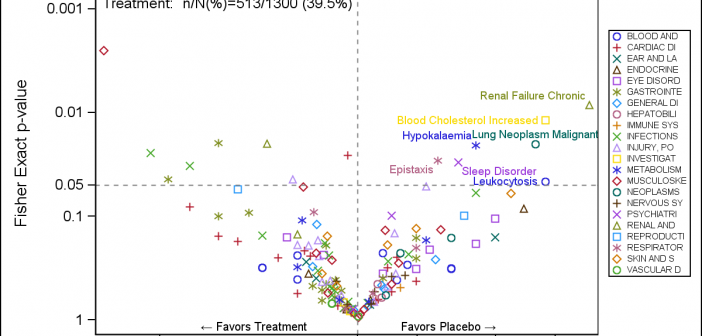
A Volcano Plot is a type of scatter-plot that is used to quickly identify changes in large data sets composed of replicate data. In the clinical domain, a Volcano Plot is used to view Risk difference (RD) of AE occurrence (%) between drug and control by preferred term. One example of