Search Results: polygon (47)

Data Visualization
Sanjay Matange 6
Layered graphs

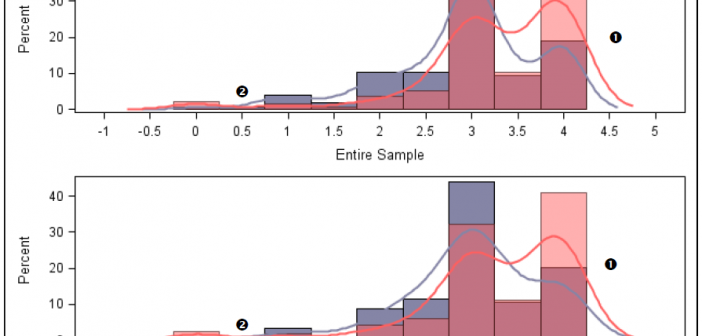
Browsing graphs on the web, this graph caught my eye:  The Arctic Sea Ice Volume Graph.   My interest is not so much in the debate on Climate Change or Global Warming.  To me, this graph has some interesting features that can help show the benefits of plot layering to

Data Visualization
Sanjay Matange 21
Broken Axis

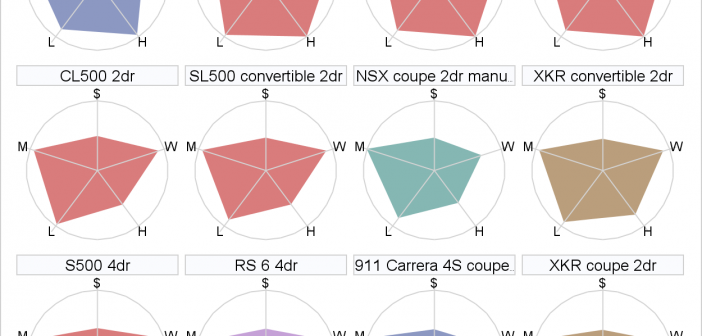
In my previous post I described the new Polygon plot statement that is included with the SAS 9.4M1 release.   So, a valid question is - what is my motivation for discussing the new features in SAS 9.4M1 when most users are at SAS 9.3 or SAS 9.2 versions?  Here are a

Data Visualization
Sanjay Matange 3
Graphs at WUSS - Part 1

It is always a pleasure to attend SAS user conferences, regional conferences and in-house events.  In addition to presenting papers, seminars and super demos to the attendees myself, my favorite activity is to attend presentations by users that include graphical data visualization.  These include using SG procedures, GTL, Designer or SAS/GRAPH.  This year

Data Visualization
Sanjay Matange 1
Clark Error Grid Graph

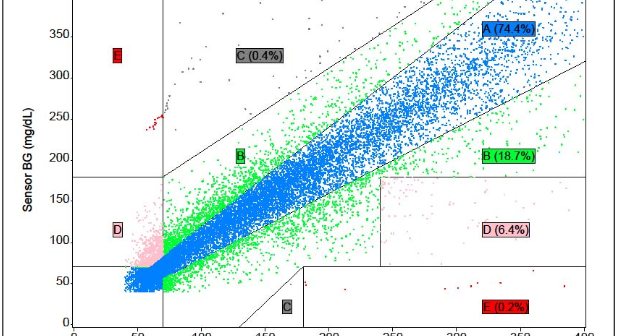
The SAS Global Forum conference last week was awesome.  From the perspective of graphics, there were more papers from uses on graphics and ODS graphics then in recent times.  I will post a summary shortly. One of the interesting papers was "#113-2013 - Creating Clark Error Grid using SAS/GRAPH and Annotate..."

Data Visualization
Sanjay Matange 4
Map overlays

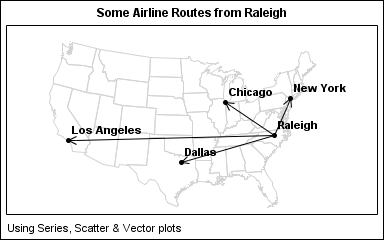
In Simple maps can go a long way, we discussed some techniques to create simple outline maps from map datasets in the MAPS library using GTL.  Now, let us take this a step further to do something more useful with this feature. For some graphs, the map information is an essential part of the

1 3 4 5