Search Results: polygon (47)

Data Visualization
Ed Odom 3
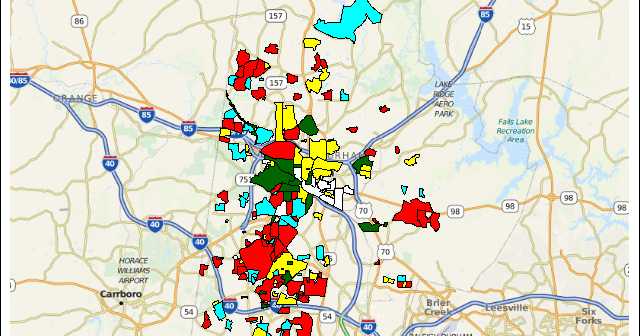
SGMAP: Using MAPIMPORT for Polygon Maps

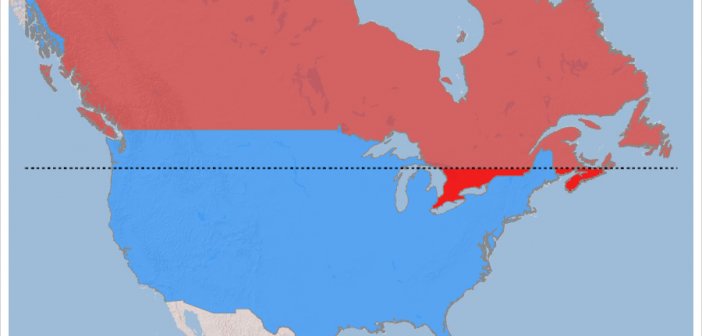
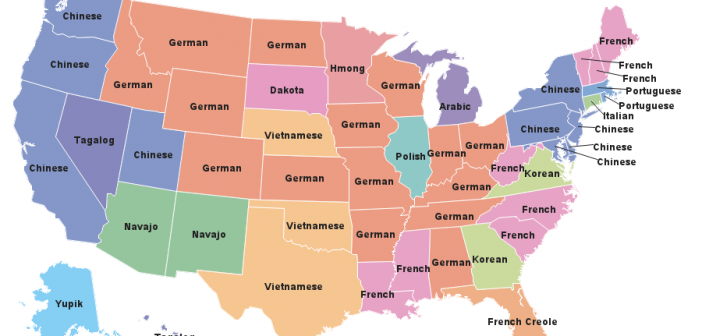
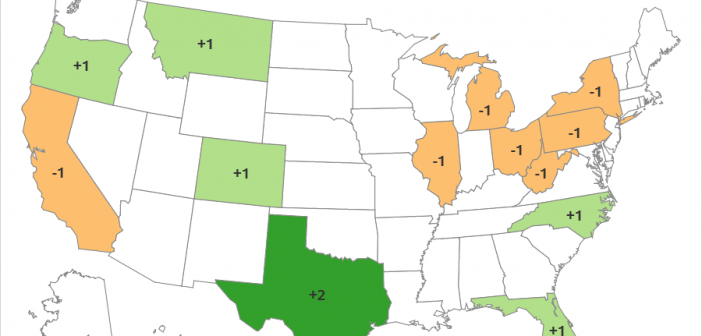
An earlier SGMAP blog used the BUBBLE statement to overlay point data on top of an Open Street Map. However, not all map features are points. Some are enclosed areas called polygons. Some map polygons share common borders such as states and counties. Others are separate, non-contiguous regions such as national parks

Data Visualization
Sanjay Matange 6
New Polygon Plot

The SAS 9.4 Maintenance 1 release is now shipping to users. This is great news for GTL and SG procedures users as this release includes some useful new features. Some of these are in direct response to your requests, and others are enhancements that we think you will come to like.

Data Visualization
Dan Heath 0
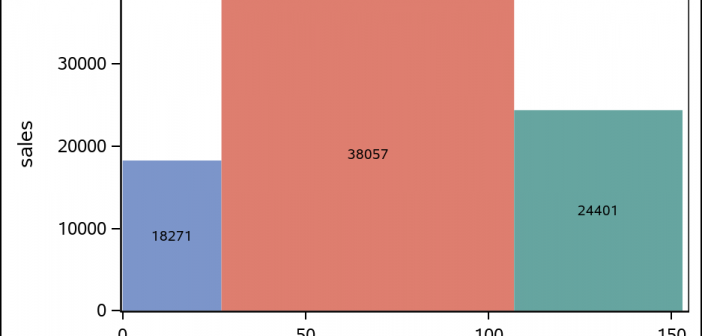
Area Bar Charts using SGPLOT

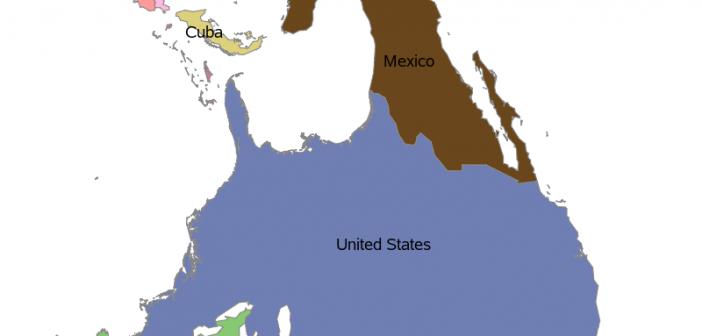
The SGPLOT procedure supports a wide variety of plot types that you can use directly or combine together to create more complex graphs. Even with this flexibility, there might be times you run across a graph that you cannot create using one of the standard plot types. An "area" bar

1 2 3 5