Search Results: panel (76)

Data Visualization
Dan Heath 4
Drillable Titles and Footnotes

Tool tip and drill-down functionality is commonly used to explore plot data in a graph, particularly on the web. Occasionally, you might even have the need to add this drill-down functionality to your titles or footnotes, possibly to reference more details or source information. The TITLE and FOOTNOTE statements in

Data Visualization | Learn SAS | Programming Tips
Sanjay Matange 0
The SGPIE Procedure - Part 2

The SAS 9.4M6 software includes a new SGPIE procedure (preproduction) as introduced in the recent article - The SGPIE Procedure.  In that article, I described the basic features of the two statements supported in the procedure, the PIE and the DONUT, with some examples. It is my humble opinion that

Data Visualization | Learn SAS | Programming Tips
Sanjay Matange 0
Spark table

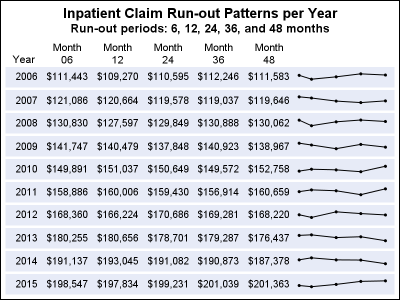
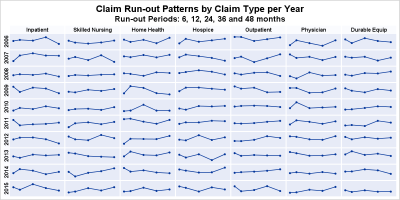
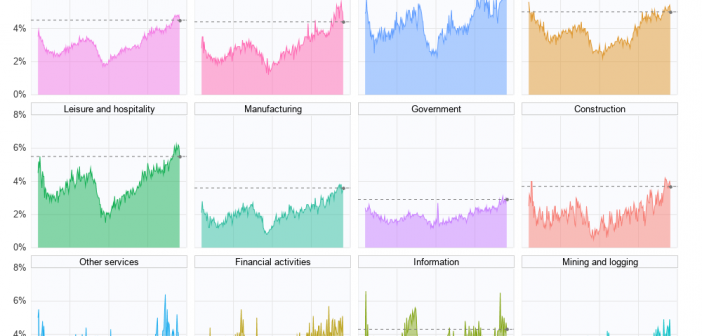
In the previous post, I discussed creating a 2D grid of spark lines by Year and Claim Type.  This graph was presented in the SESUG conference held last week on SAS campus in the paper ""Methods for creating Sparklines using SAS" by Rick Andrews.  This grid of sparklines was actually the

Data Visualization | Learn SAS | Programming Tips
Sanjay Matange 4
Spark grid

The 25th annual SESUG conference was held at in the SAS campus this week.  I had the opportunity to meet and chat with many users and attend many excellent presentations.  I will write about those that stood out (graphically) in my view. One excellent presentation was on "Methods for creating

Data Visualization | Programming Tips
Warren F. Kuhfeld 0
Advanced ODS Graphics: A deeper dive into documents, dynamics, and data objects

You can modify all of the components of the graphs that analytical procedures produce: the data object, graph template, and the dynamic variables. This post takes a closer look at dynamic variables (which you can see by using PROC DOCUMENT) and data objects and explores graphs that are constructed from more than one data object.

1 2 3 4 5 8