Search Results: highlow (67)

Data Visualization
Sanjay Matange 0
Broken Y-Axis with SAS 9.2

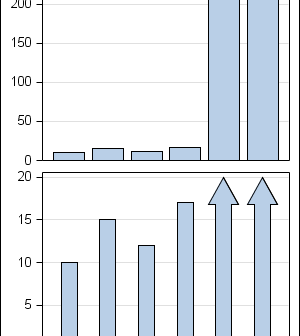
In the previous post on Broken Y-Axis, I reviewed different ways to display data as a Bar Chart, where the response values for some categories are many orders of magnitude larger than the other values.  These tall bars force  the display of other values to be squeezed down thus making it harder to compare

Data Visualization
Sanjay Matange 4
Broken Y-Axis

Often we want to display data as a bar chart where a few observations have large values compared to the rest.  Comparison between the smaller values becomes hard as the small bars are squeezed by the tall bars.  Here is an example data, and a bar chart showing the data. The large values

Data Visualization
Sanjay Matange 1
Bar chart on interval axis

Recently, a user asked about creating a Bar Chart of Value by Date, where the dates are displayed on a scaled interval axis.   Consider this simulated data set of value by date and treatment shown below.  This data set only has one value for each date and treatment combination. We can use the VBAR statement

1 5 6 7