Search Results: datalabel barchart (13)

Data Visualization
Dan Heath 0
Optimizing bar label placement

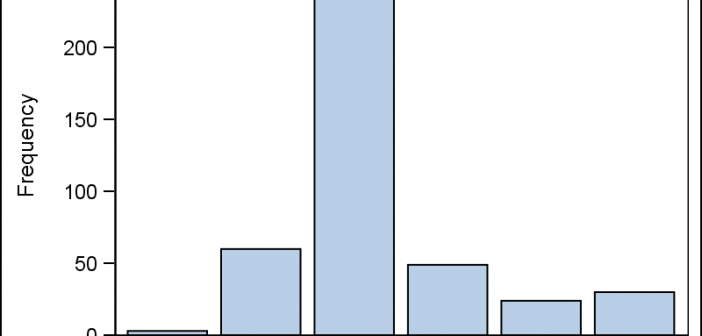
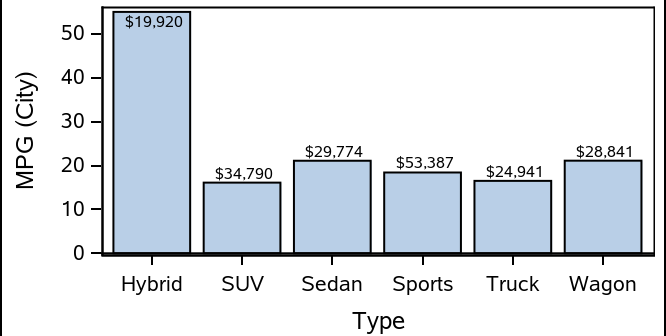
When creating bar charts, it is very common to display labels with the bars to make it easier to determine the bar values or to provide additional information in the chart. However, these labels can take away valuable data space, particularly if you generate a smaller-sized graph. As you see

Data Visualization
Sanjay Matange 0
Fun with Bar Charts

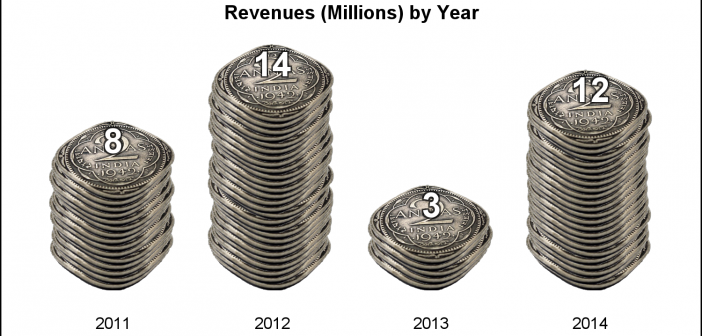
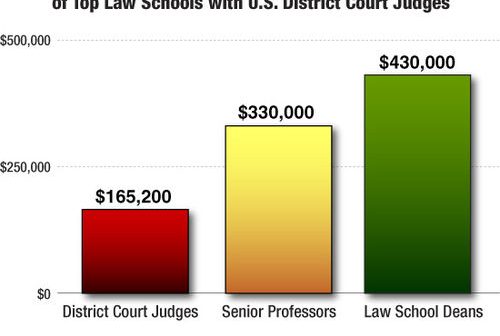
As Sheldon Cooper would say, this is the first episode of "Fun with Charts".  I did not find a cool term like "Vexillology" and "Cartography" is taken by map making, so let us go with "Chartology". Yesterday, I saw a couple of interesting bar charts as shown on the right.  I thought

Data Visualization
Sanjay Matange 1
The HIGHLOW Plot

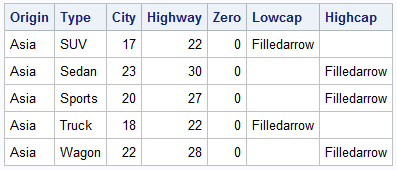
SG Procedures and GTL provide you with a large set of plot statements, such as BarChart, ScatterPlot, BoxPlot and more.  You can use them for the intended purpose, and all is well and good.  However, the real fun starts when you leverage a plot to do something that was not

Data Visualization
Sanjay Matange 3
Survey Charts

Often we have situations where the category values on the graph have long character strings.  This is often the case when graphing survey responses to questions.  The questions may be sentences, sometimes moderately long. With SAS 9.4, GTL and SG now support the ability to display tick values split over

Data Visualization
Sanjay Matange 3
Butterfly plots

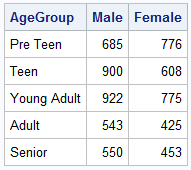
When comparing results by category and group,  putting the items to be compared close together usually leads to a graph that is easier to decode.  Take the case of the data (simulated) shown below. Here we have population by age group and sex.  To compare the population by sex, it is

Data Visualization
Sanjay Matange 6
Bar-Line graph

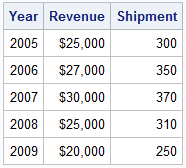
A user recently posted a question in the SAS communities forum about  how to best display two measures by one classifier using a Bar-Line graph, where the scale of the two measures is vastly different.  This got me thinking about various different ways to represent such data.  Here are some of my thoughts,

1 2