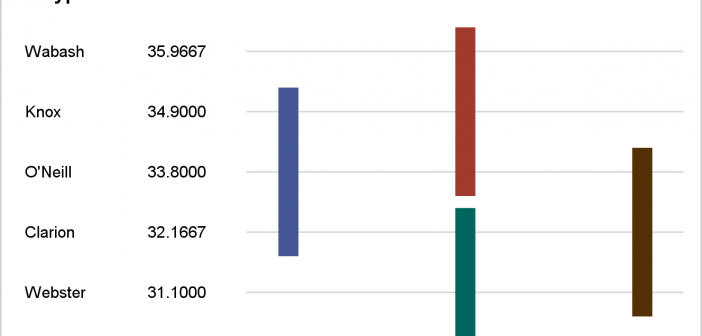
This post presents some basic aspects of ODS Graphics: enabling, selecting, and displaying graphs.

This post presents some basic aspects of ODS Graphics: enabling, selecting, and displaying graphs.
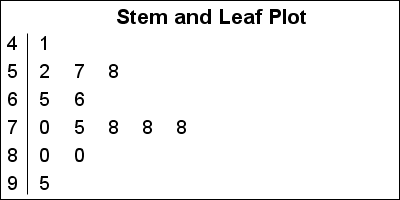
A Stem and Leaf plot is a visual that can help quickly visualize the distribution of the data. This graph was particularly useful before the advent of modern statistical graphs including the Histogram and Box Plot. One nice feature of the plot is it shows the actual values in the
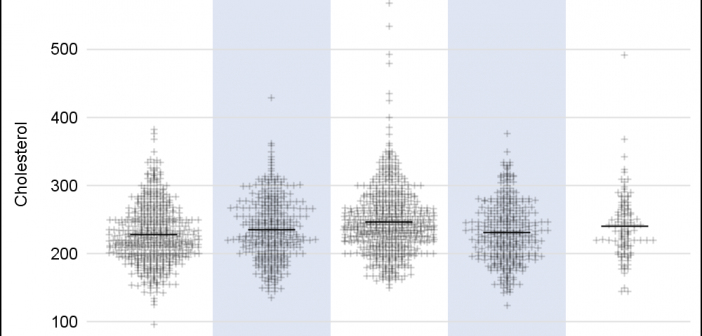
A frequently requested statistical graph is the scatter plot by with discrete categories along with mean value for each category. Searching for a "Scatter with Mean" will return a lot of requests for such a graph in SAS, Stata, R and other statistical software. Such a graph is very easy
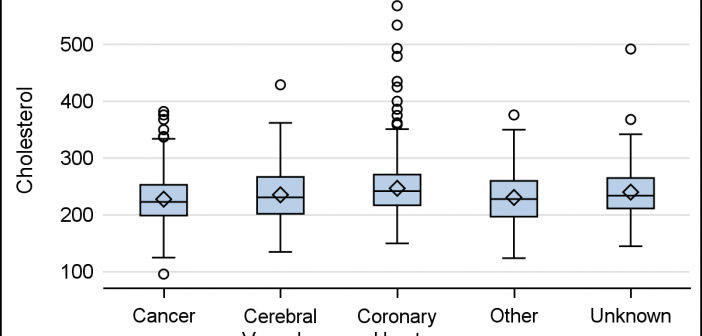
On a recent trip I met a long time user and early adopter of ODS Graphics who started using GTL with SAS 9.1.3, even before it was released as production with SAS 9.2. This user has presented many papers at SGF on GTL and some hands-on sessions on ODS Graphics Designer.
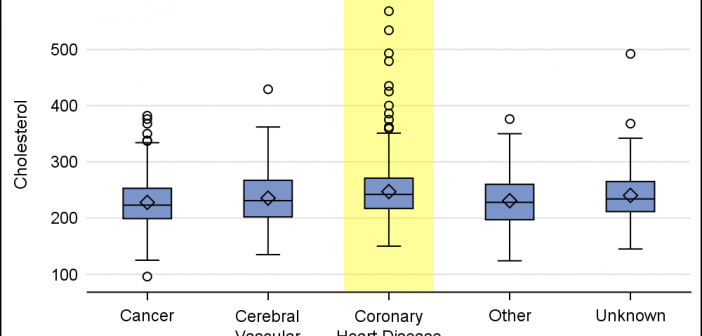
When presenting information in form of a graph we show the data and let the reader draw the inferences. However, often one may want to draw the attention of the reader towards some aspect of the graph or data. For one such case, a user asked how to highlight one
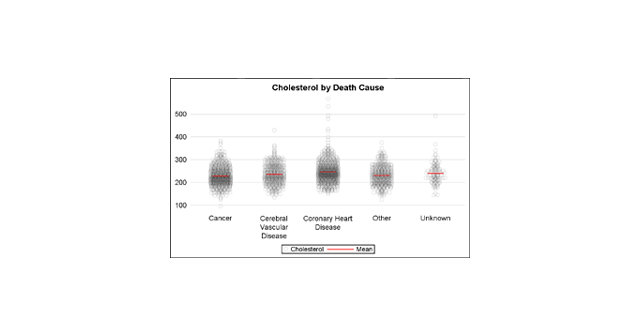
This article is motivated by a recent question on the Communities Web Site on creating a scatter plot with additional summary information. Recently, I described how to create a scatter plot with a box overlay. While such graphs have been discussed in earlier posts, this article provided a visual benefit
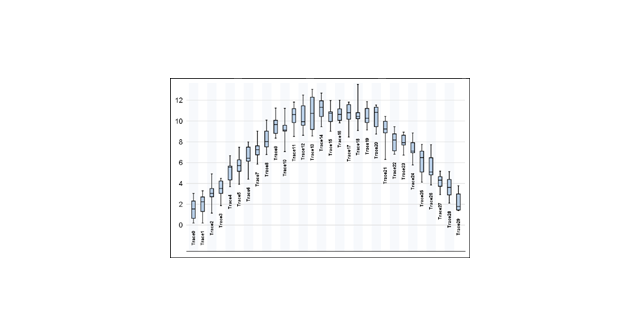
Back in 2013, I wrote a paper for the SAS Global Forum, reviewing the attributes that go towards making a good graph. In this paper, I covered many recommendations from industry thought leaders that can help enhance the effectiveness of graphs to deliver the intended information. One of the aspects that

Index of articles on "Getting Started with SGPLOT Procedure". Getting Started with SGPLOT - Part 1 - Scatter Plot. Getting Started with SGPLOT - Part 2 - VBAR. Getting Started with SGPLOT - Part 3 - VBOX. Getting Started with SGPLOT - Part 4 - Series Plot. Getting Started with
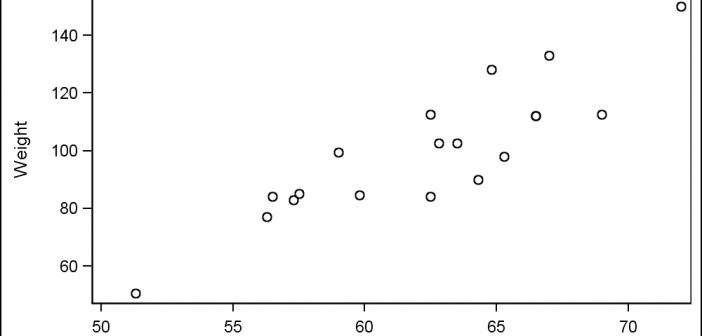
Last week I had the pleasure of presenting my paper "Graphs are Easy with SAS 9.4" at the Boston SAS Users Group meeting. The turn out was large and over 75% of the audience appeared to be using SAS 9.4 back home. This was good as my paper was focused on the cool new
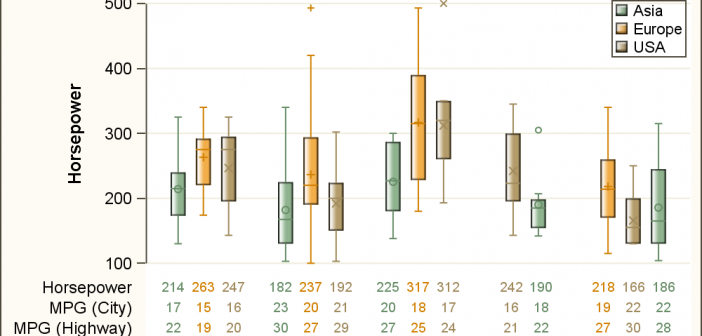
As often is the case, this article is prompted by a recent post on the SAS/GRAPH and ODS Graphics page communities page. A user wanted to create a Graph Table showing a bar chart with tabular data for each of the category values along the x-axis. The user was creatively using