Search Results: box (88)

Data Visualization
Sanjay Matange 4
Boxplot with connect

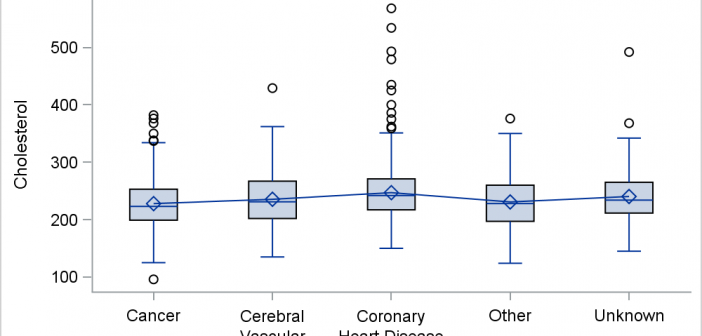
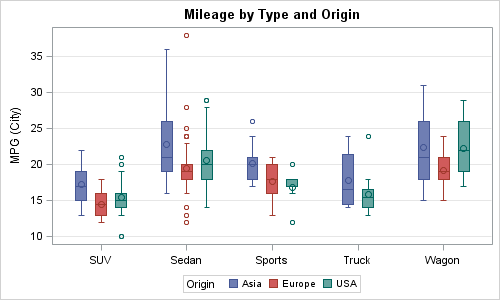
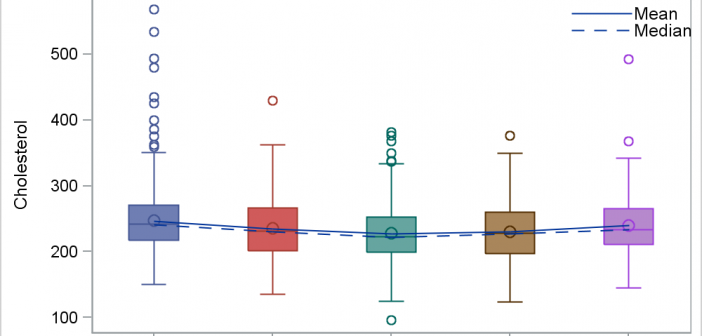
This blog post is motivated by a post by a user on the communities page about creating a box plot with colored boxes by category and multiple connect lines. Normally, a box plot can be drawn by category, with a single connect line for one of the statistical values of

Data Visualization
Sanjay Matange 6
Custom Box Plots

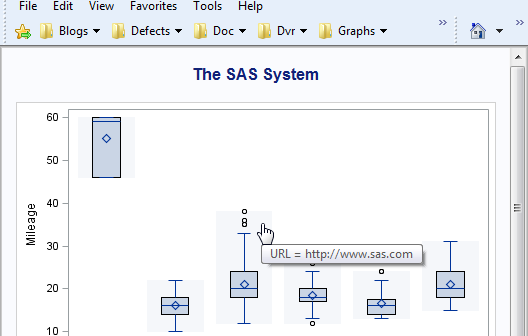
A frequent question we get from users is how to create a box plot with custom whiskers lengths.  Some want to plot the 10th and 90th percentile, while other want the 5th and 95th percentiles.  The VBOX statement in the SGPLOT  procedure does not provide for custom whiskers.  Also, unlike GTL,

Data Visualization
Sanjay Matange 4
Box with Scatter Overlay

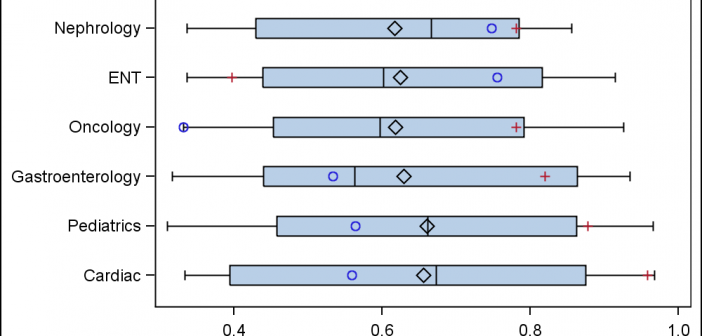
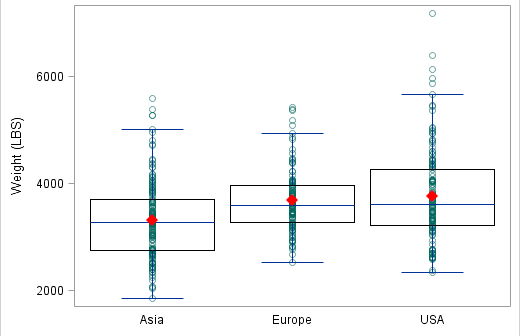
A common request we have been often hearing is for display of the distribution of data as a box plot, along with some detailed information overlaid.  For example, one may have ratings data of all the hospitals in a region by different specialty, and you want to view this distribution

1 2 3 4 9