Strengthen your programming skills with tips and techniques from the experts
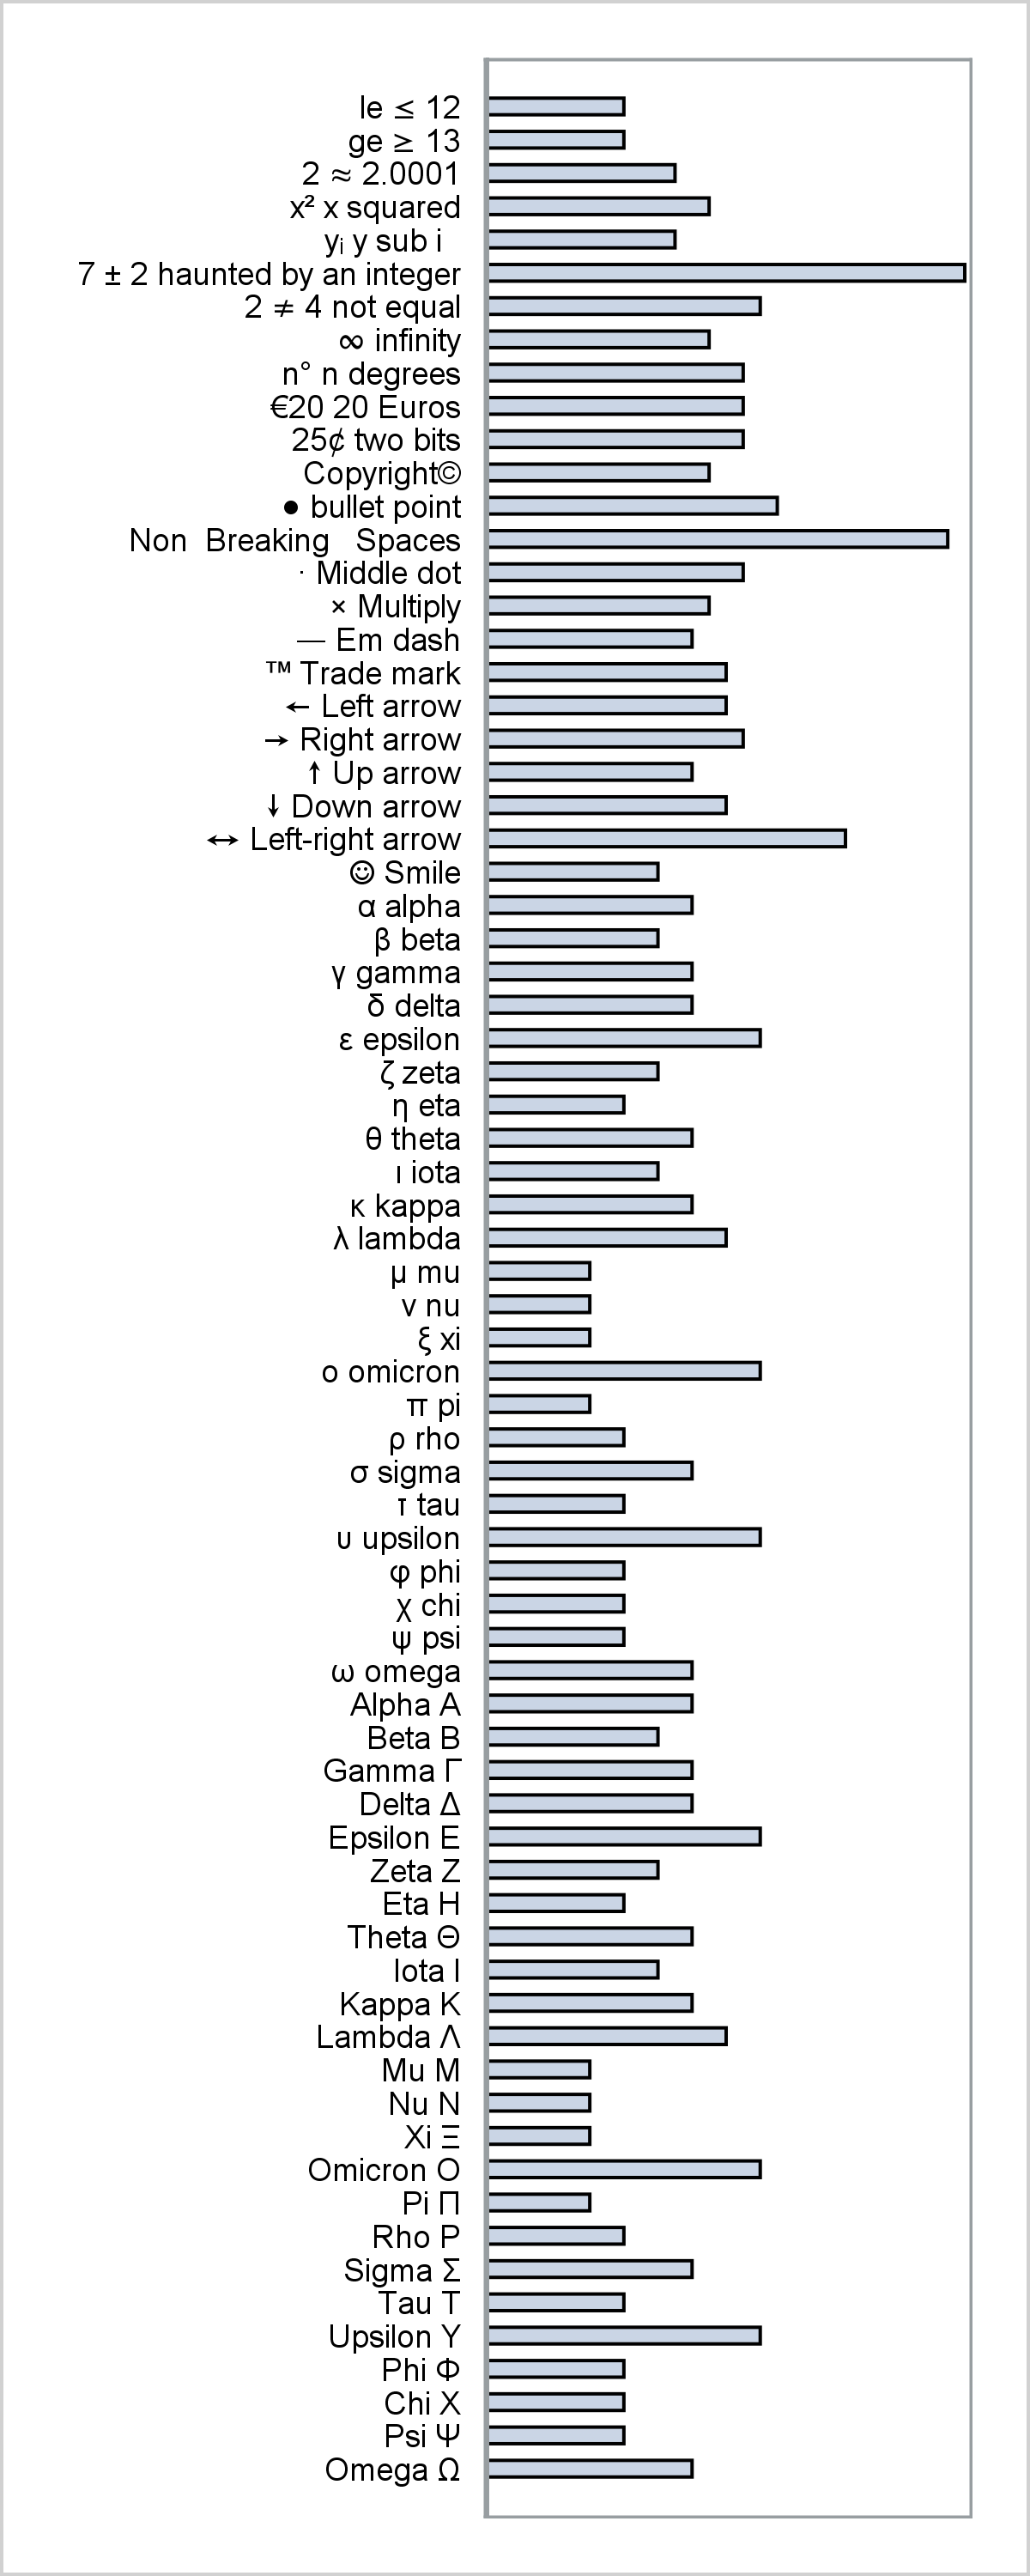
Advanced ODS Graphics: Axis tables that contain special characters

This post provides a general macro that enables you to easily display special characters (Unicode) in axis table columns.