Learn SAS

Learn about the latest tips, tutorials, upcoming events and certifications
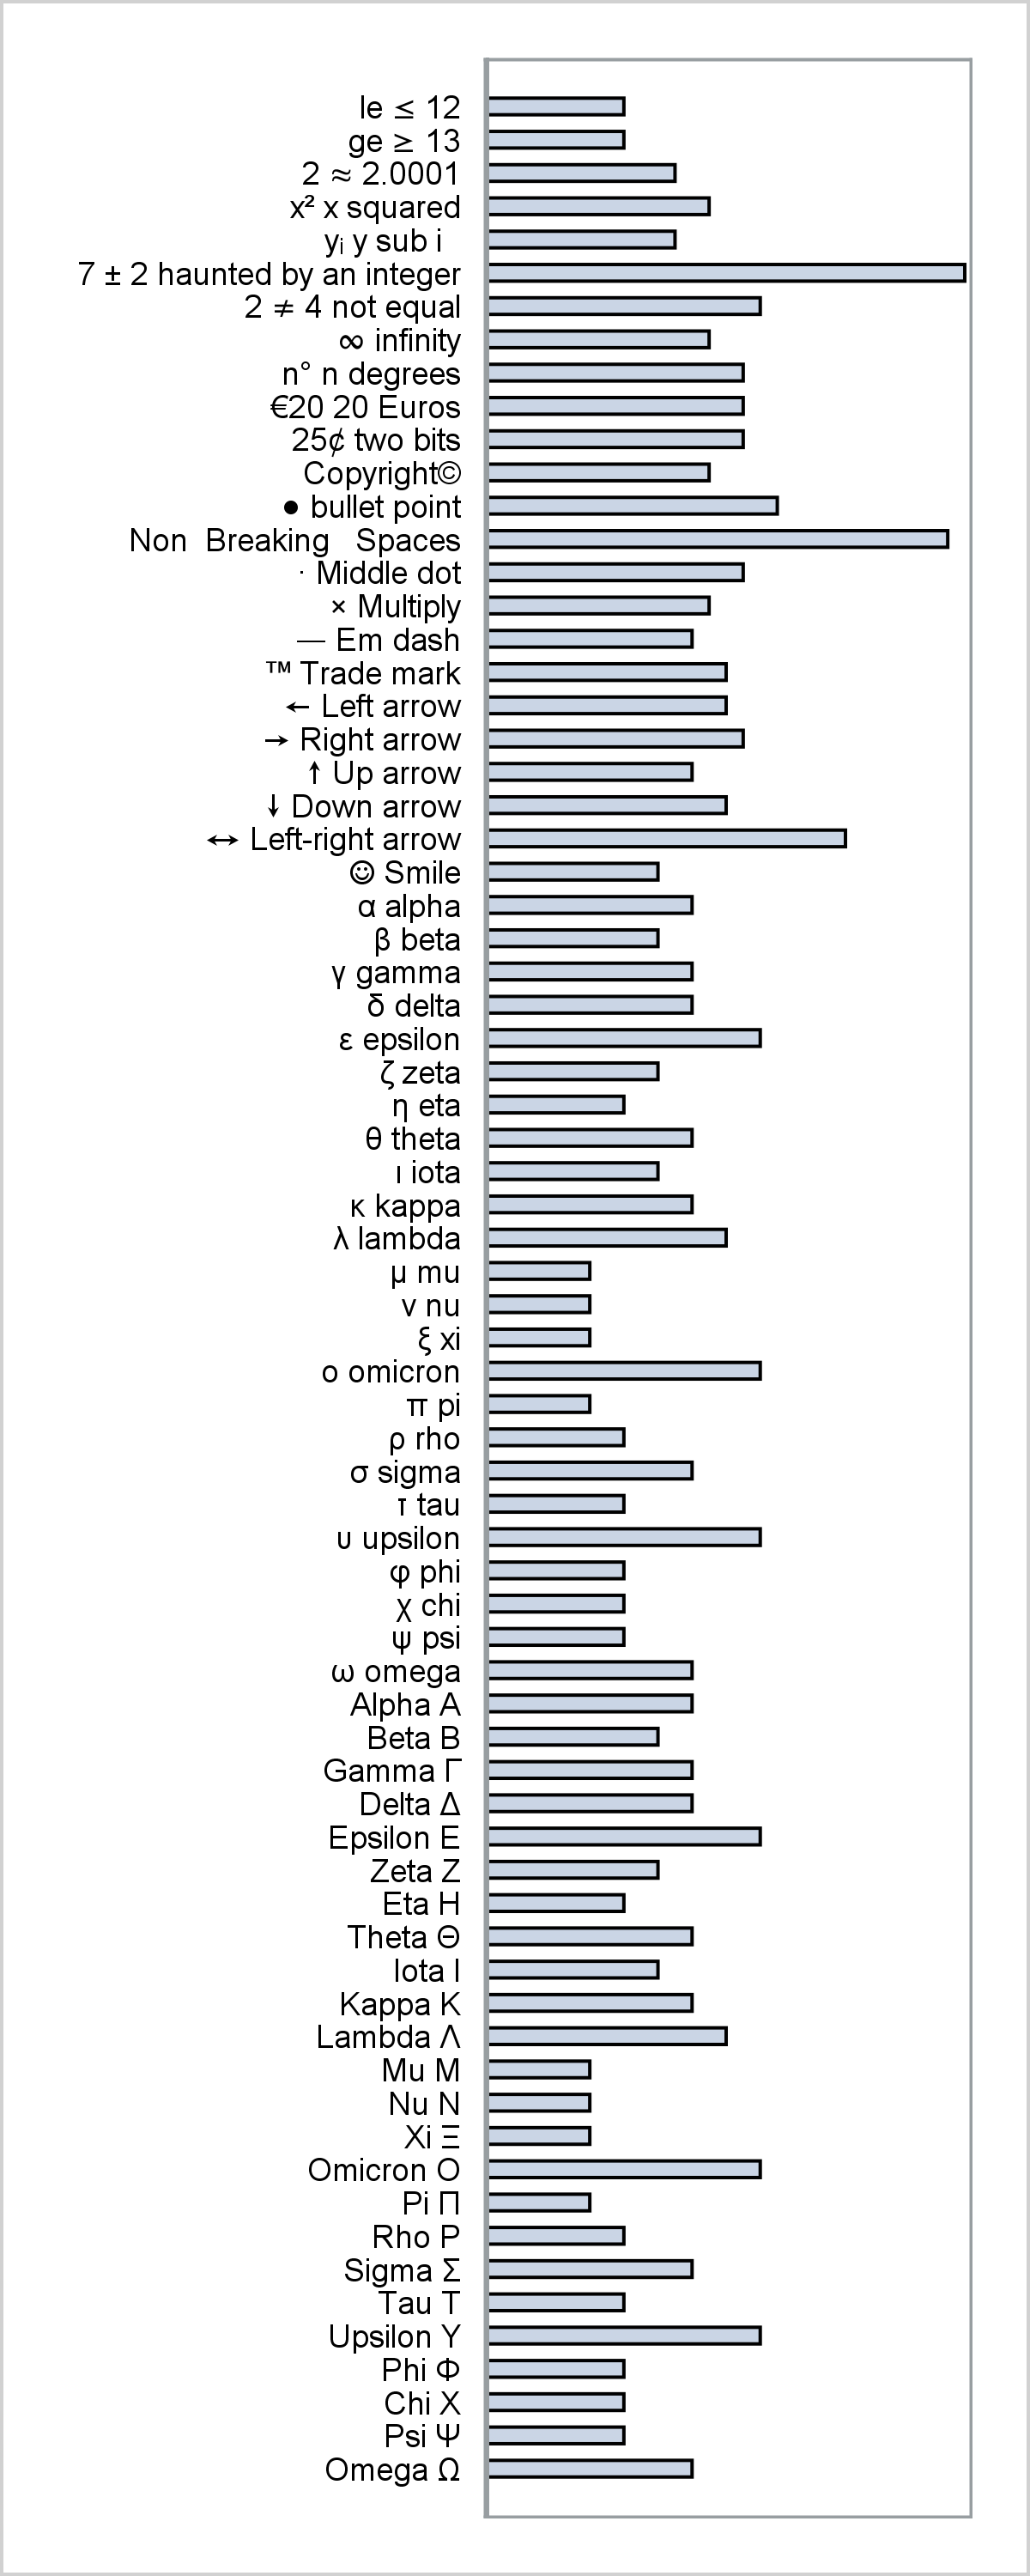
Analytics | Data Visualization | Learn SAS | Programming Tips
Sanjay Matange 0
Getting started with SGPLOT - Part 8 - Horizontal HighLow Plot

On a recent visit to an In-House Users Group meeting at a Pharmaceutical company, I presented a 1/2 day seminar on creating Clinical Graphs using SG Procedures.  Polling the audience for their experience with these procedures indicated that many SAS users are not familiar with these new ways to create graphs. So,

Learn SAS | Programming Tips
Rick Wicklin 0
Data-driven simulation

In a large simulation study, it can be convenient to have a "control file" that contains the parameters for the study. My recent article about how to simulate multivariate normal clusters demonstrates a simple example of this technique. The simulation in that article uses an input data set that contains

1 261 262 263 264 265 409