 My new SAS Press book “An Introduction to SAS Visual Analytics” (written in collaboration with Tricia Aanderud and Rob Collum) covers all of the different aspects of SAS® Visual Analytics, including how to develop reports, load data, and handle administration. Below is an example of the types of tips that you can find in the book. This one is about the Parallel Period function that is used in some of the Derived Item calculations.
Derived Items
In SAS Visual Analytics, there are Derived Items which are preset calculations that you can build off your existing measures. To get to them, just Right-click a measure and select Create and choose from one of date-based aggregated measures.
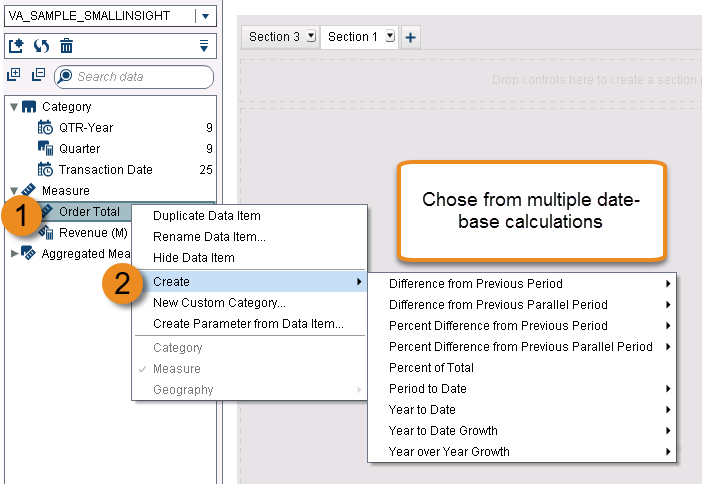
These calculations are based off of Relative and Parallel Period functions. In this post, we are going to look into how the Parallel Period is calculated and what you can change to get the results that you're after.
Parallel Period
Let’s look at the parallel period derived item based on the Gross Total Amount measure. Parallel periods can be a bit tricky to understand at first since there’s a lot of options used in the formula that can be manipulated. In this example, we created a Year Over Year Growth derived item.
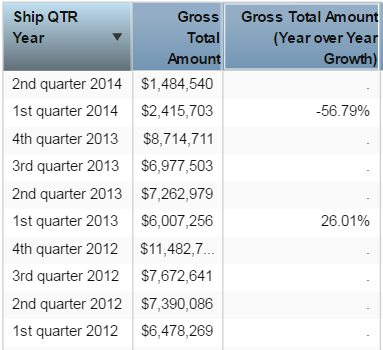
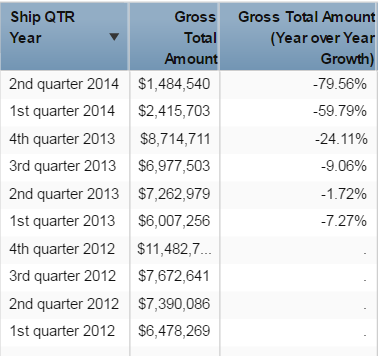
By default, you only see results for the first quarter of each year when the derived item is grouped by quarters instead of year. The percentages appear incorrect when you look at total year-over-year amounts or quarterly results.
This can be adjusted so we see the results for each quarter. When you edit the aggregated data item, here is what the formula looks like:
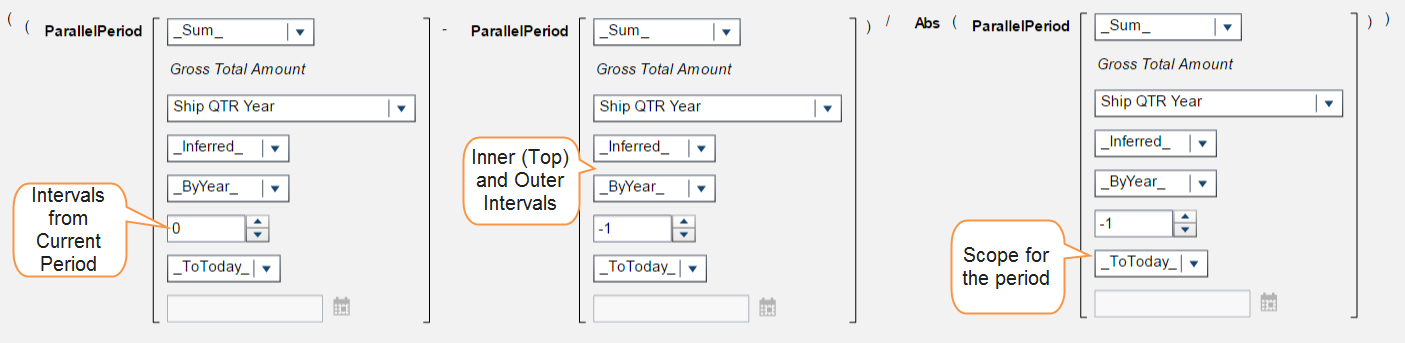
You can think of the formula in more simple terms like this:
(Period this year – Period last year) / Period last year
This formula is computing the difference between periods as you would for any amounts by subtracting the previous amount from the current amount and then dividing by the previous amount. The different periods can be determined from a field that counts the intervals from the current period. This is displayed in first section in the image above. The value 0 looks at the period of the current date that the row is in. The other parallel period functions have a -1 so that they look one period back based on the selections that you have made in the inner and outer intervals, which are the fields pointed out in the second Parallel Period function above.
We will change those in a few steps, but first we have to figure out why our percentages do not make sense, which is due to the scope of the period (shown in the third function of the figure). The scope tells the formula how much of a period to aggregate. By using the _ToToday_ option we are telling the system to run the calculations for today’s date (February 27th).
This is why we are only getting results for the first quarters of each year and why those numbers don’t even match when looking at the first quarters of the years. The formula is only taking the Gross Total Amount for transactions from January 1st to February 27th and not the whole first quarter. This option is what you would want to use if you had a dashboard for the current year and were tracking data as it got updated daily, weekly, etc.
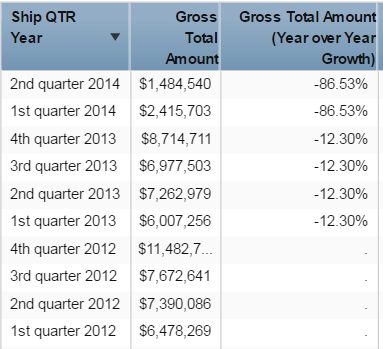
When we change the option to _Full_ then the formula takes the full quarter of each date and we get the results shown above. The quarters for 2012 are still missing because there is no previous data to compare to, but now we have the year-over-year totals comparing every quarter to the quarter from the previous year.
Now our calculation is for the year-over-year growth, but what if we just wanted to look at the years?
To change what amounts are calculated we can change the intervals from the inner and outer fields that were shown in the full formula. Right now in our formula, our inner interval is _Inferred_ and our outer is _ByYear_. When you use the _Inferred_ option, the formula will look at the row date used for the derived measure and determine what should be used. Since we are using Ship QTR, the inner interval resolves to quarter. When we change that to _ByYear_ we get the results on the left. Now we have our year over year growth based just on the year.


1 Comment
hello Ryan, good article, customers need to calculate such measures. If you need to calculate last12 wks % variation of sales (current last 12 wks – 12 wks last year) / 12 wks last year, how to do it so that it is independent of year? The same if you need to calculate for last 52 wks of sale? Pls advise.