Get the right information, with visual impact, to the people who need it
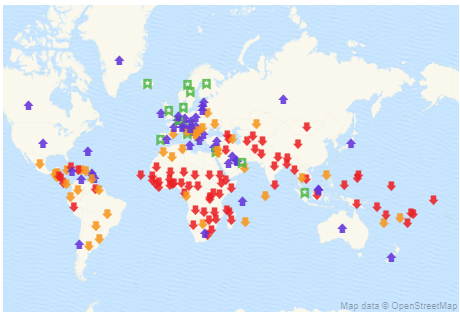
Jazz up a Geo Map with colorful icon-based display rules

Jazz up your Geo Map or Network Analysis graph by applying icon-based display rule markers instead of color markers on the map. With SAS Visual Analytics, you may have already used display rules by populating intervals or adding color-mapped values for report objects. Now, you can jazz up your Geo