Get the right information, with visual impact, to the people who need it
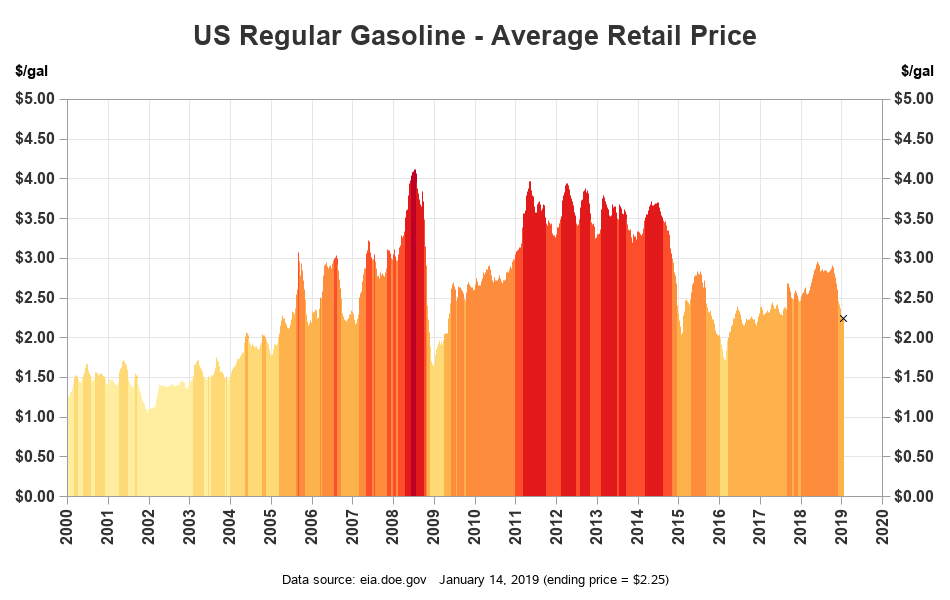
Let's track the falling gasoline prices!

When I fill up my daily-driver Prius, the price of gasoline isn't that important. But when I occasionally take a trip in my V8 Suburban, I pay a lot more attention! Therefore I was pleasantly surprised when I noticed that gasoline prices have been falling. How much have they fallen,