In the second of three posts on using automated analysis with SAS Visual Analytics,  we used the automated analysis object to get a better understanding of our variable of interest, X-Sell and Up-sell Flag, and how it is influenced by other variables in our dataset.
In this third and final post, you'll see how to filter the data even more to set up your customer care workers for success.
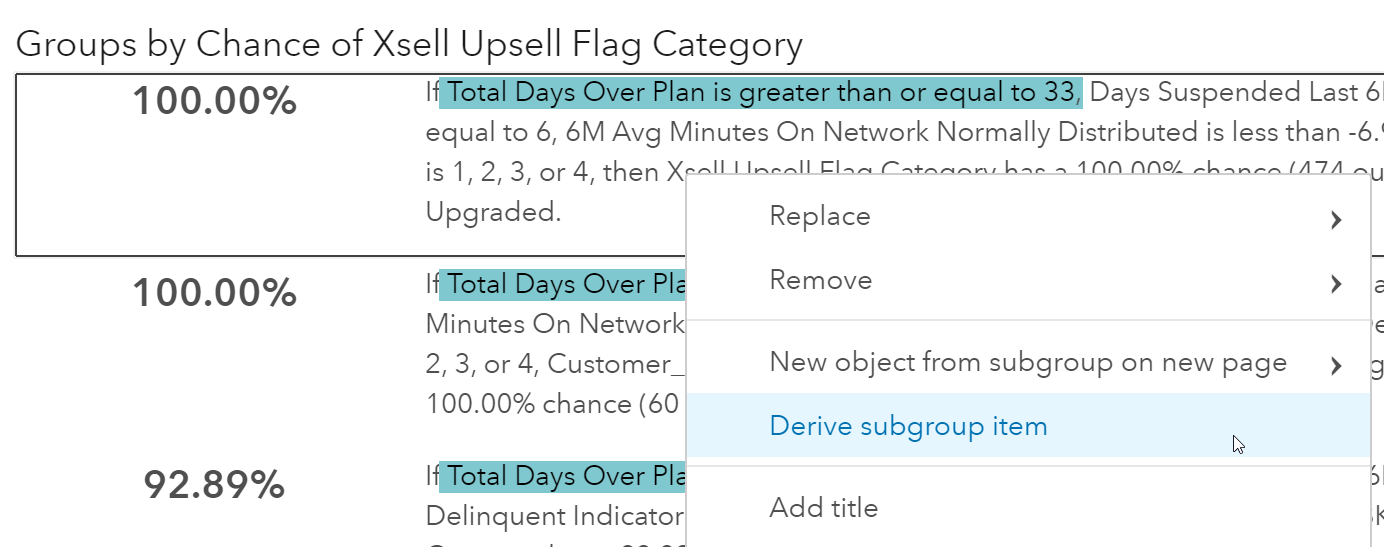
Remember how on the left-hand side of the analysis we had a list of subgroups with their probabilities? We can use those to filter our data or create additional subsets of data. Let’s create a calculated category from one of the subgroups and then use that to filter a list table of customers. If I right click on the 87% subgroup and select Derive subgroup item a new calculated category will appear in my Data pane.
Here is the new data item located in our data pane:

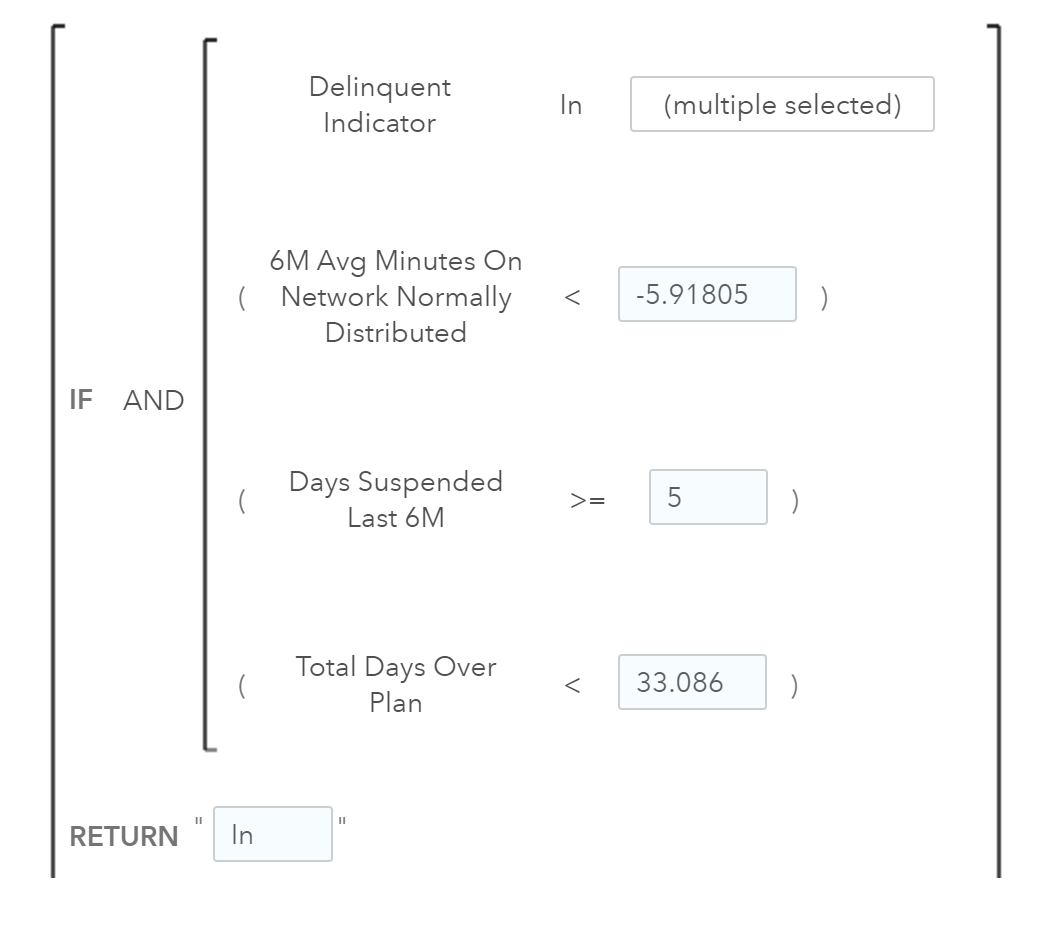
To see the filter for this data object we can right click on it and select edit.
We can now use this category as a filter. Here we have a basic customer table that does not have a filter applied:
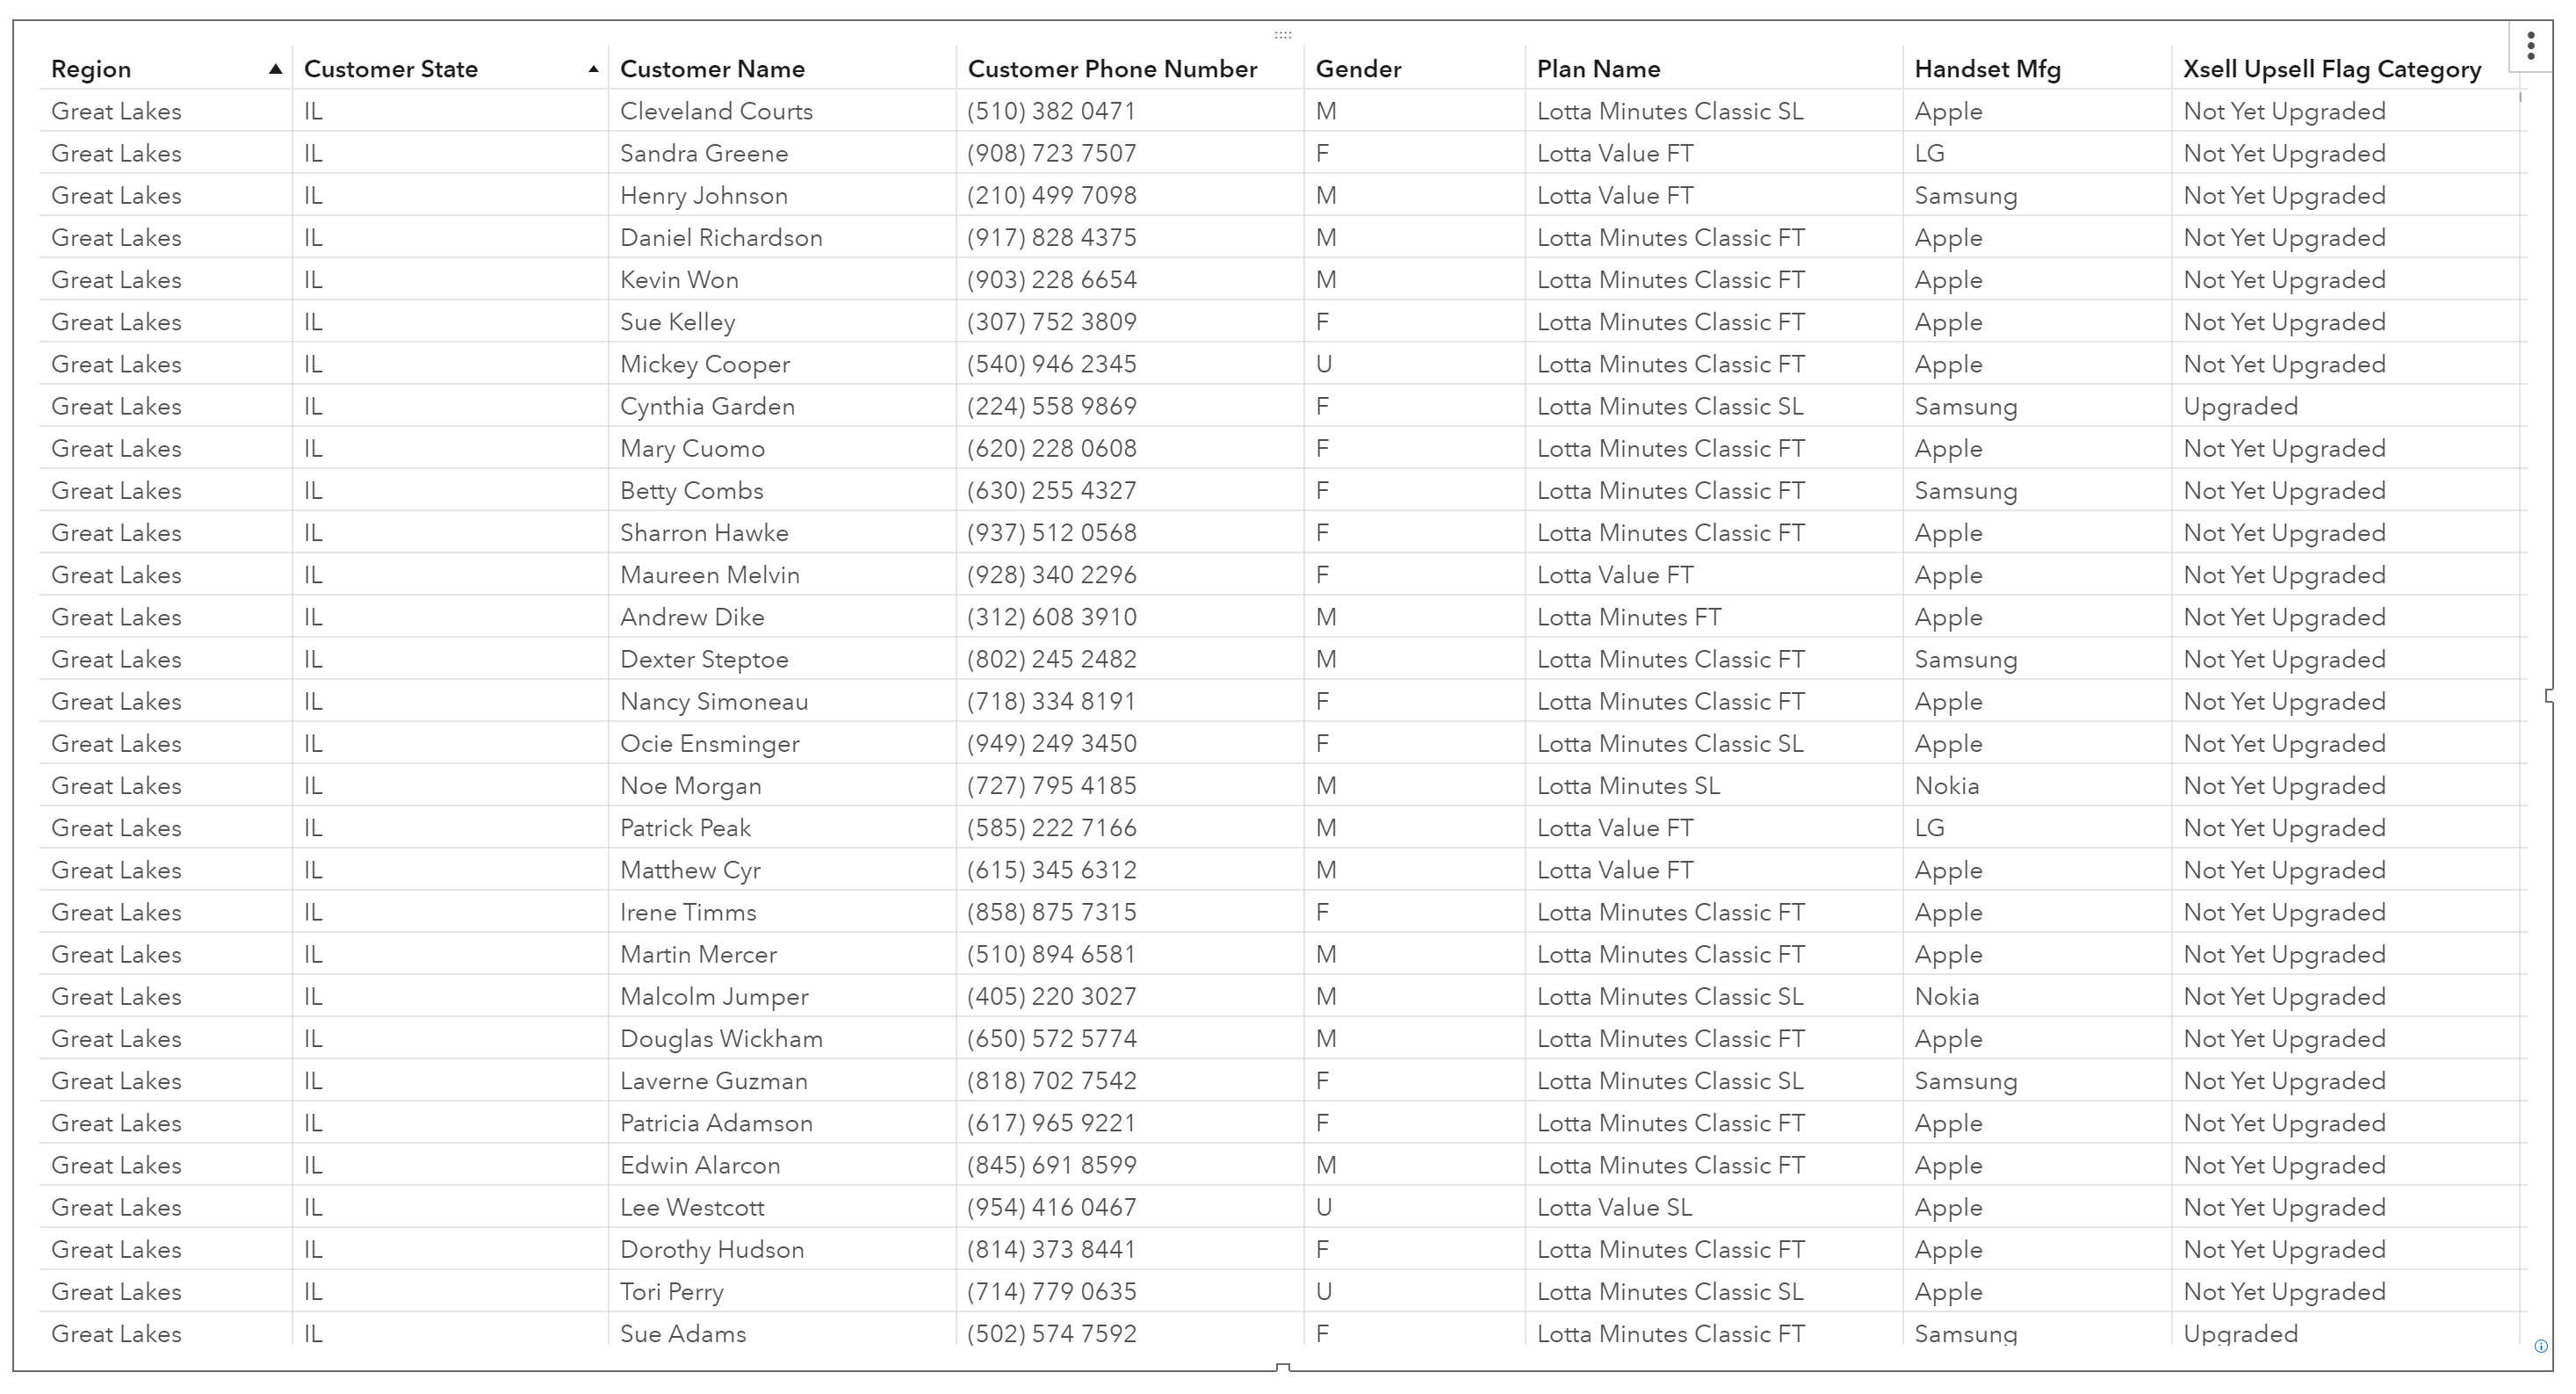
If we apply the filter for customers who fall in the 87% subgroup and a filter for those customers who have not yet upgraded, we have a list of customers that are highly likely to upgrade.

We could give this list to our customer care centers and have them call these customers to see if they want to upgrade. Alternatively, the customer care center could use this filter to target customers for upgrades when they call in. So, if a customer calls into the center, the employee could see if that customer meets the criteria set out in the filter. If they do, they are highly likely to upgrade, and the employee should provide an offer to them.
How to match callers with sales channels
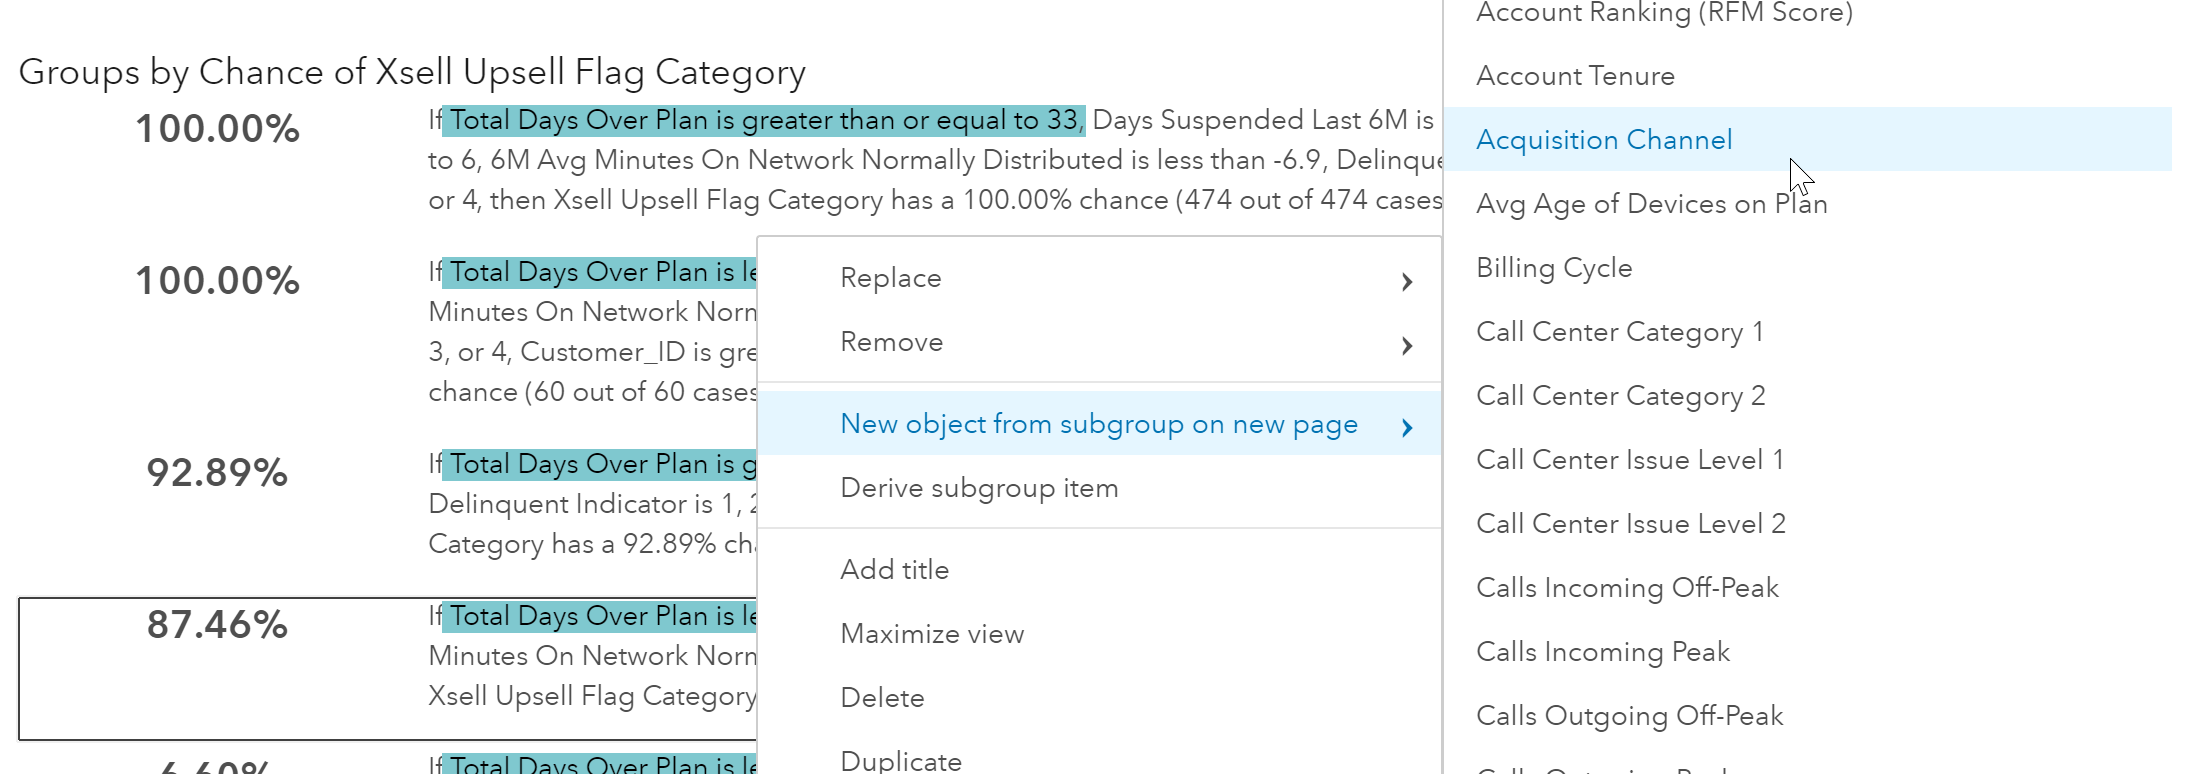
Let’s go back to our automated analysis and perform one more action. We’ll create a new object from the subgroup and assess the group by acquisition channel. This will help us determine which acquisition channel(s) the customers who are in our 87% subgroup purchased their plans from. Then we’ll know which sales teams we need to communicate to about our sales strategy.
To do this we’ll select our 87% group, right click and select New object from subgroup on new page, then Acquisition Channel.
Here we see the customers who are in or out of our subgroup by acquisition channel.

Because it is difficult to see the "in" group, we’ll remove those customers who are out of our subgroup by selecting out from the legend then right click and select New filter from selection, then Exclude selection.

Now we can see which acquisition channel the 87% subgroup purchased their current plan from and how many have already upgraded.

In less than a minute using SAS Visual Analytics' automated analysis we’ve gained business insights based on machine learning that would have taken hours to produce manually. Not only that, we’ve got easy-to-understand results that are built with natural language processing. We can now analyze all variables and remove any bias, ensuring we don’t miss key findings. Business users gain access to analytics without them having the expert skills needed to build models and interpret results. Automated analysis is a start and SAS is committed to investing time and resources into this new wave of BI. Look for more enhancements in future releases!
Miss the previous posts?
This is the third of a three-part series demonstrating automated analysis using SAS Visual Analytics on Viya. Part 1 describes a common visualization approach to handling customer data that leaves room for error and missed opportunities. Part 2 shows improvements through automated analysis.
Want to see automated analysis in action? Watch this video!