Get the right information, with visual impact, to the people who need it
Compute and visualize binomial proportions in SAS

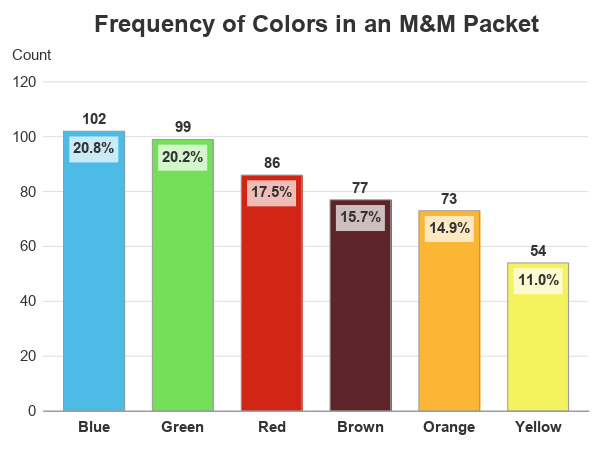
Computing rates and proportions is a common task in data analysis. When you are computing several proportions, it is helpful to visualize how the rates vary among subgroups of the population. Examples of proportions that depend on subgroups include: Mortality rates for various types of cancers Incarceration rates by race