Find out how analytics, from data mining to cognitive computing, is changing the way we do business
SAS OnDemand for Academics 授業利用では使用できる製品が追加されます

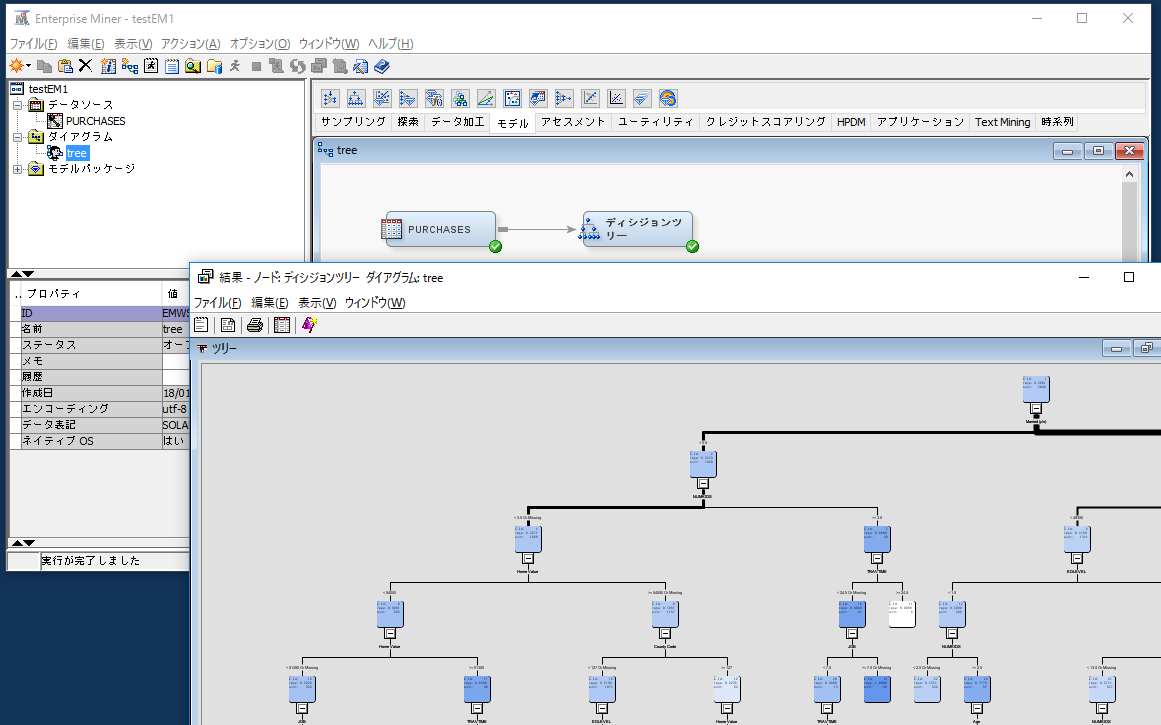
前回、SAS OnDemand for Academics (SODA) の Course 機能を活用することで、授業準備の手間が軽減されることをご紹介しましたが、実は、Cource 登録にはもう一つのメリットがあります。 SODA は、SAS Studioを基本のインターフェイスとしていますが、Course 登録により使用できる製品が増えます。 SAS Enterprise Guide : ポイント&クリック操作によるWindowsアプリケーション SAS Enterprise Miner : GUIによるデータマイニング・ツール SAS Forecast Server : 時系列予測の自動作成ツール これらは、統計の学習よりも、実際のビジネス等の現場で素早く統計手法を適用するためのツールで、基礎を学習した上で、より応用に際して活用できるものです。