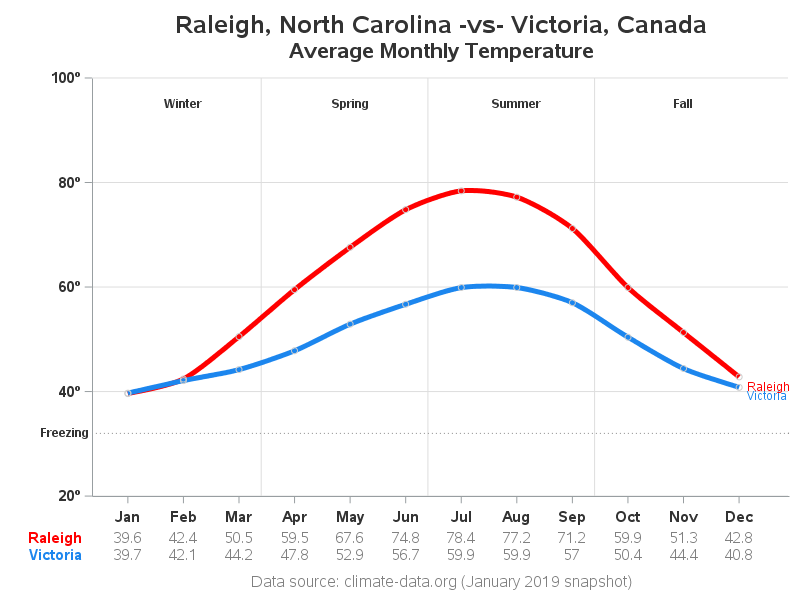
Are winters colder in North Carolina, or Canada?

If someone proposes a bet to you, then you should be suspicious that they already know they're going to win. And one frequent topic of such bets is the weather... What if I bet you there's a city in Canada with a warmer average January temperature than Raleigh, NC? You