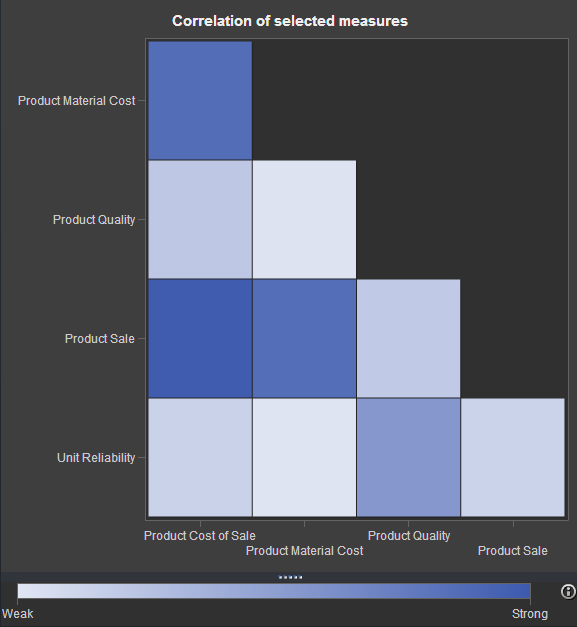
Imagine you're a business analyst who just discovered a pattern or trend that could significantly help your organization. What do you do next? You share it. Using SAS® Visual Analytics, you've published your results to the Web and mobile device before, but this time you'd rather work with your findings in
Tag: Visual Analytics
Everyday visual analytics
Announcing SAS for ‘Demand Signal Analytics’
From Gartner to IDC to the trade press, the watchwords in the supply chain for rest of this decade appear to be “resiliency” and “responsiveness”. It’s not going to be about promotion-based pull-through, and it’s most definitely not going to be about channel incentive-based push-through. What it’s going to be
Exploring social networks with SAS Visual Analytics
In this interconnected world, it is more important than ever to understand not just details about your data, but also how its different parts are related to each other. Social networks reveal often surprising details about what people think about your product or services, how they are linked to other