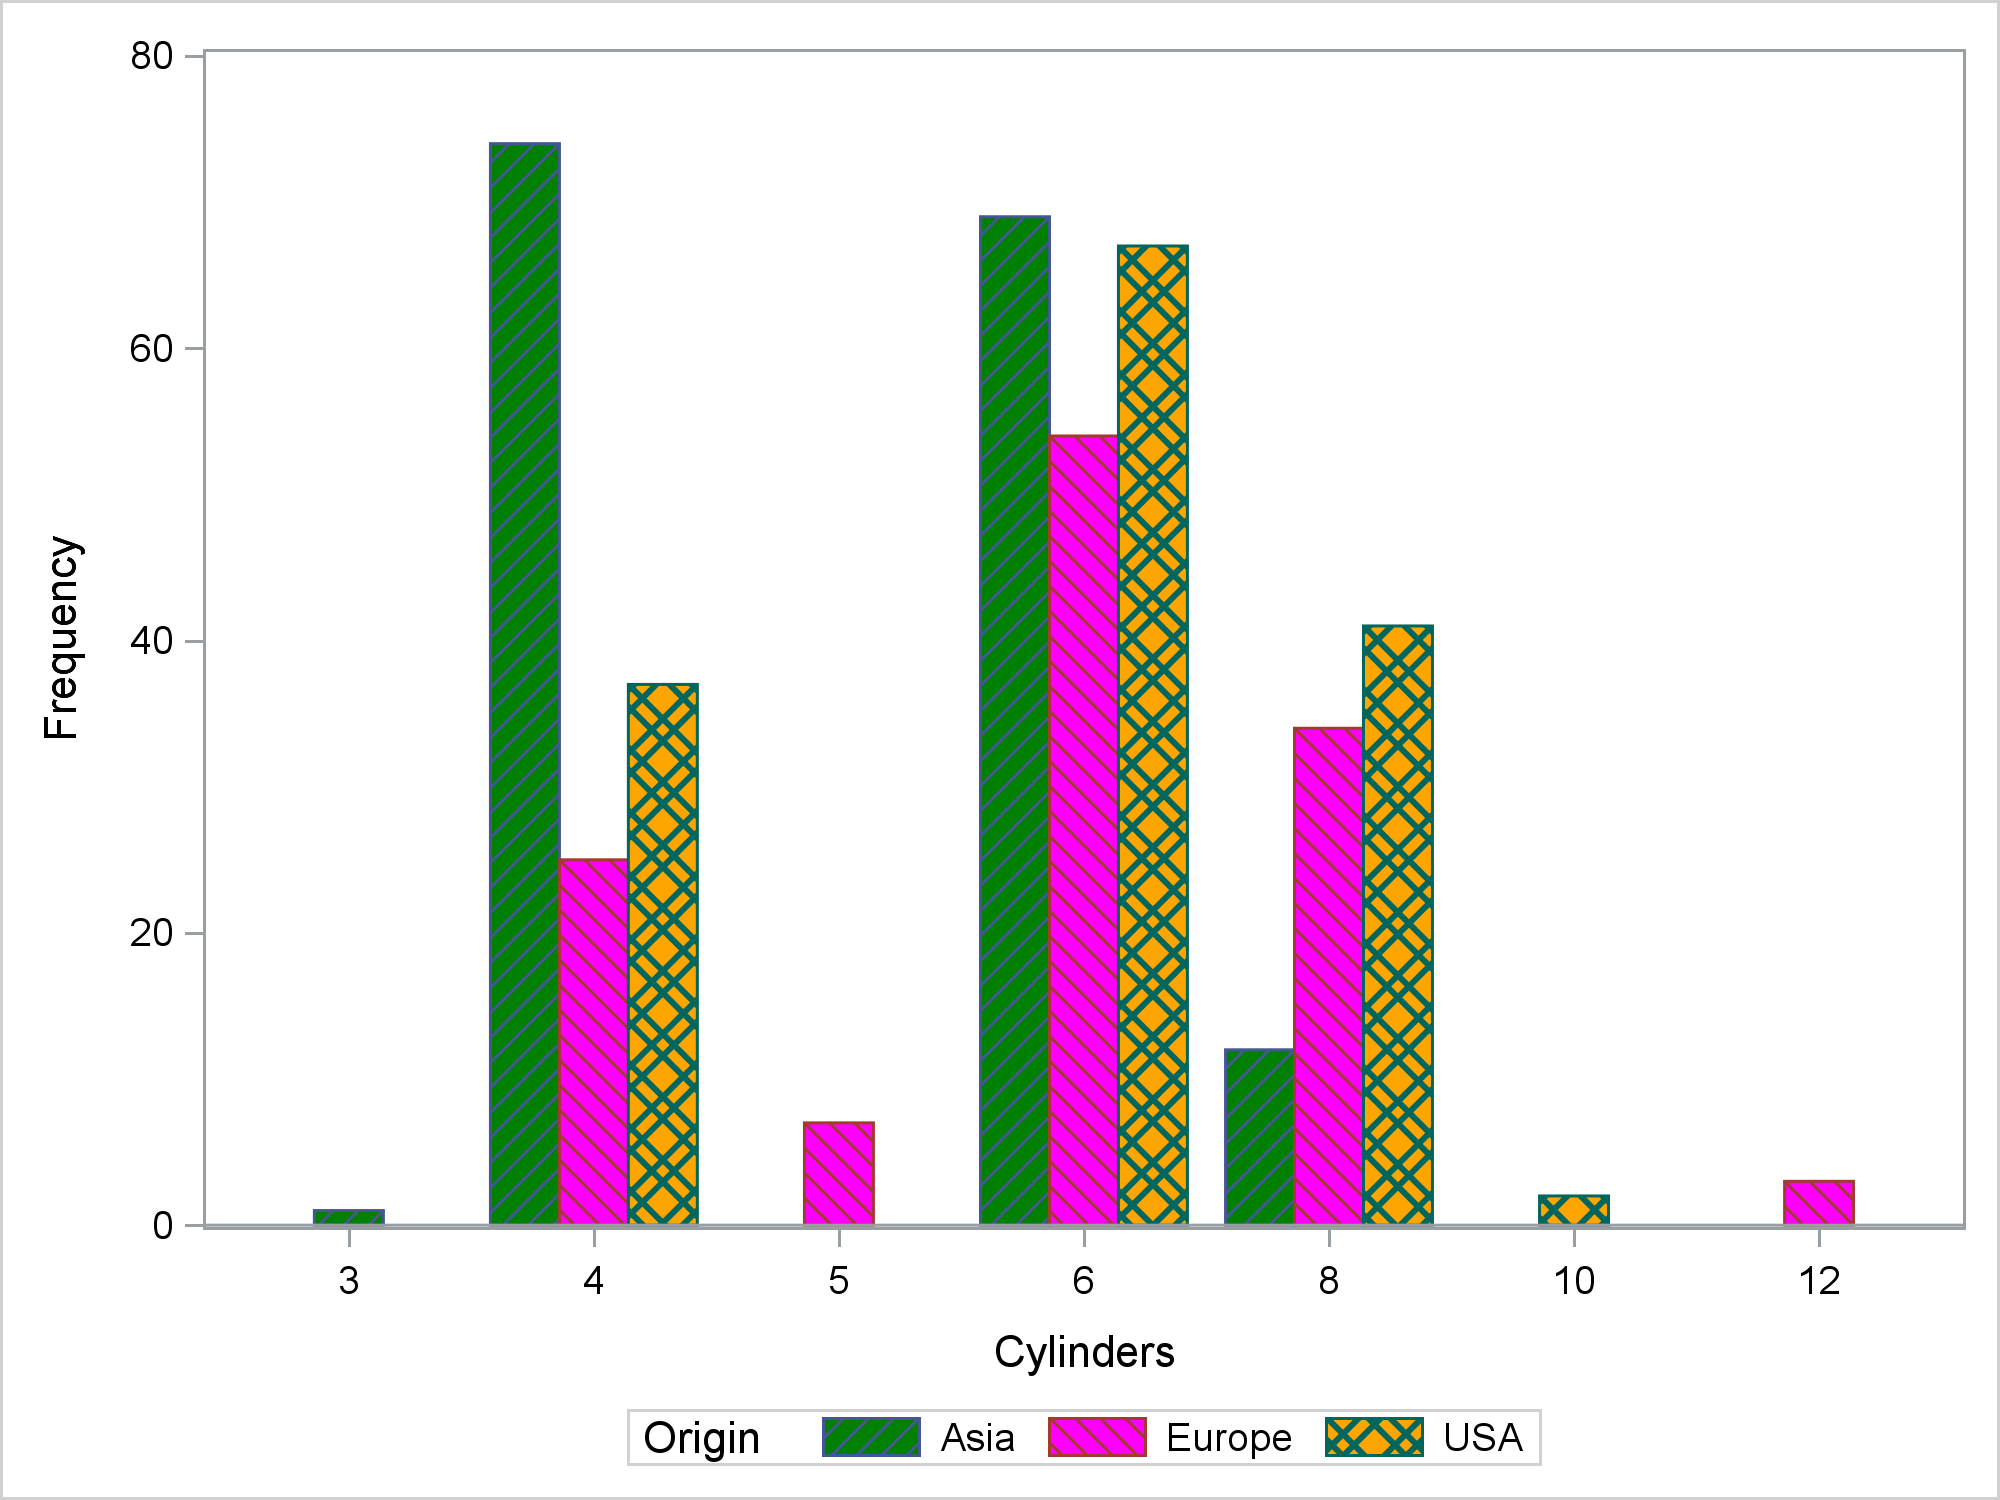
The STYLEATTRS statement in PROC SGPLOT enables you to override colors, markers, line patterns, fill patterns, and axis break patterns in ODS styles, without requiring you to change the ODS style template.
Tag: STYLEATTRS
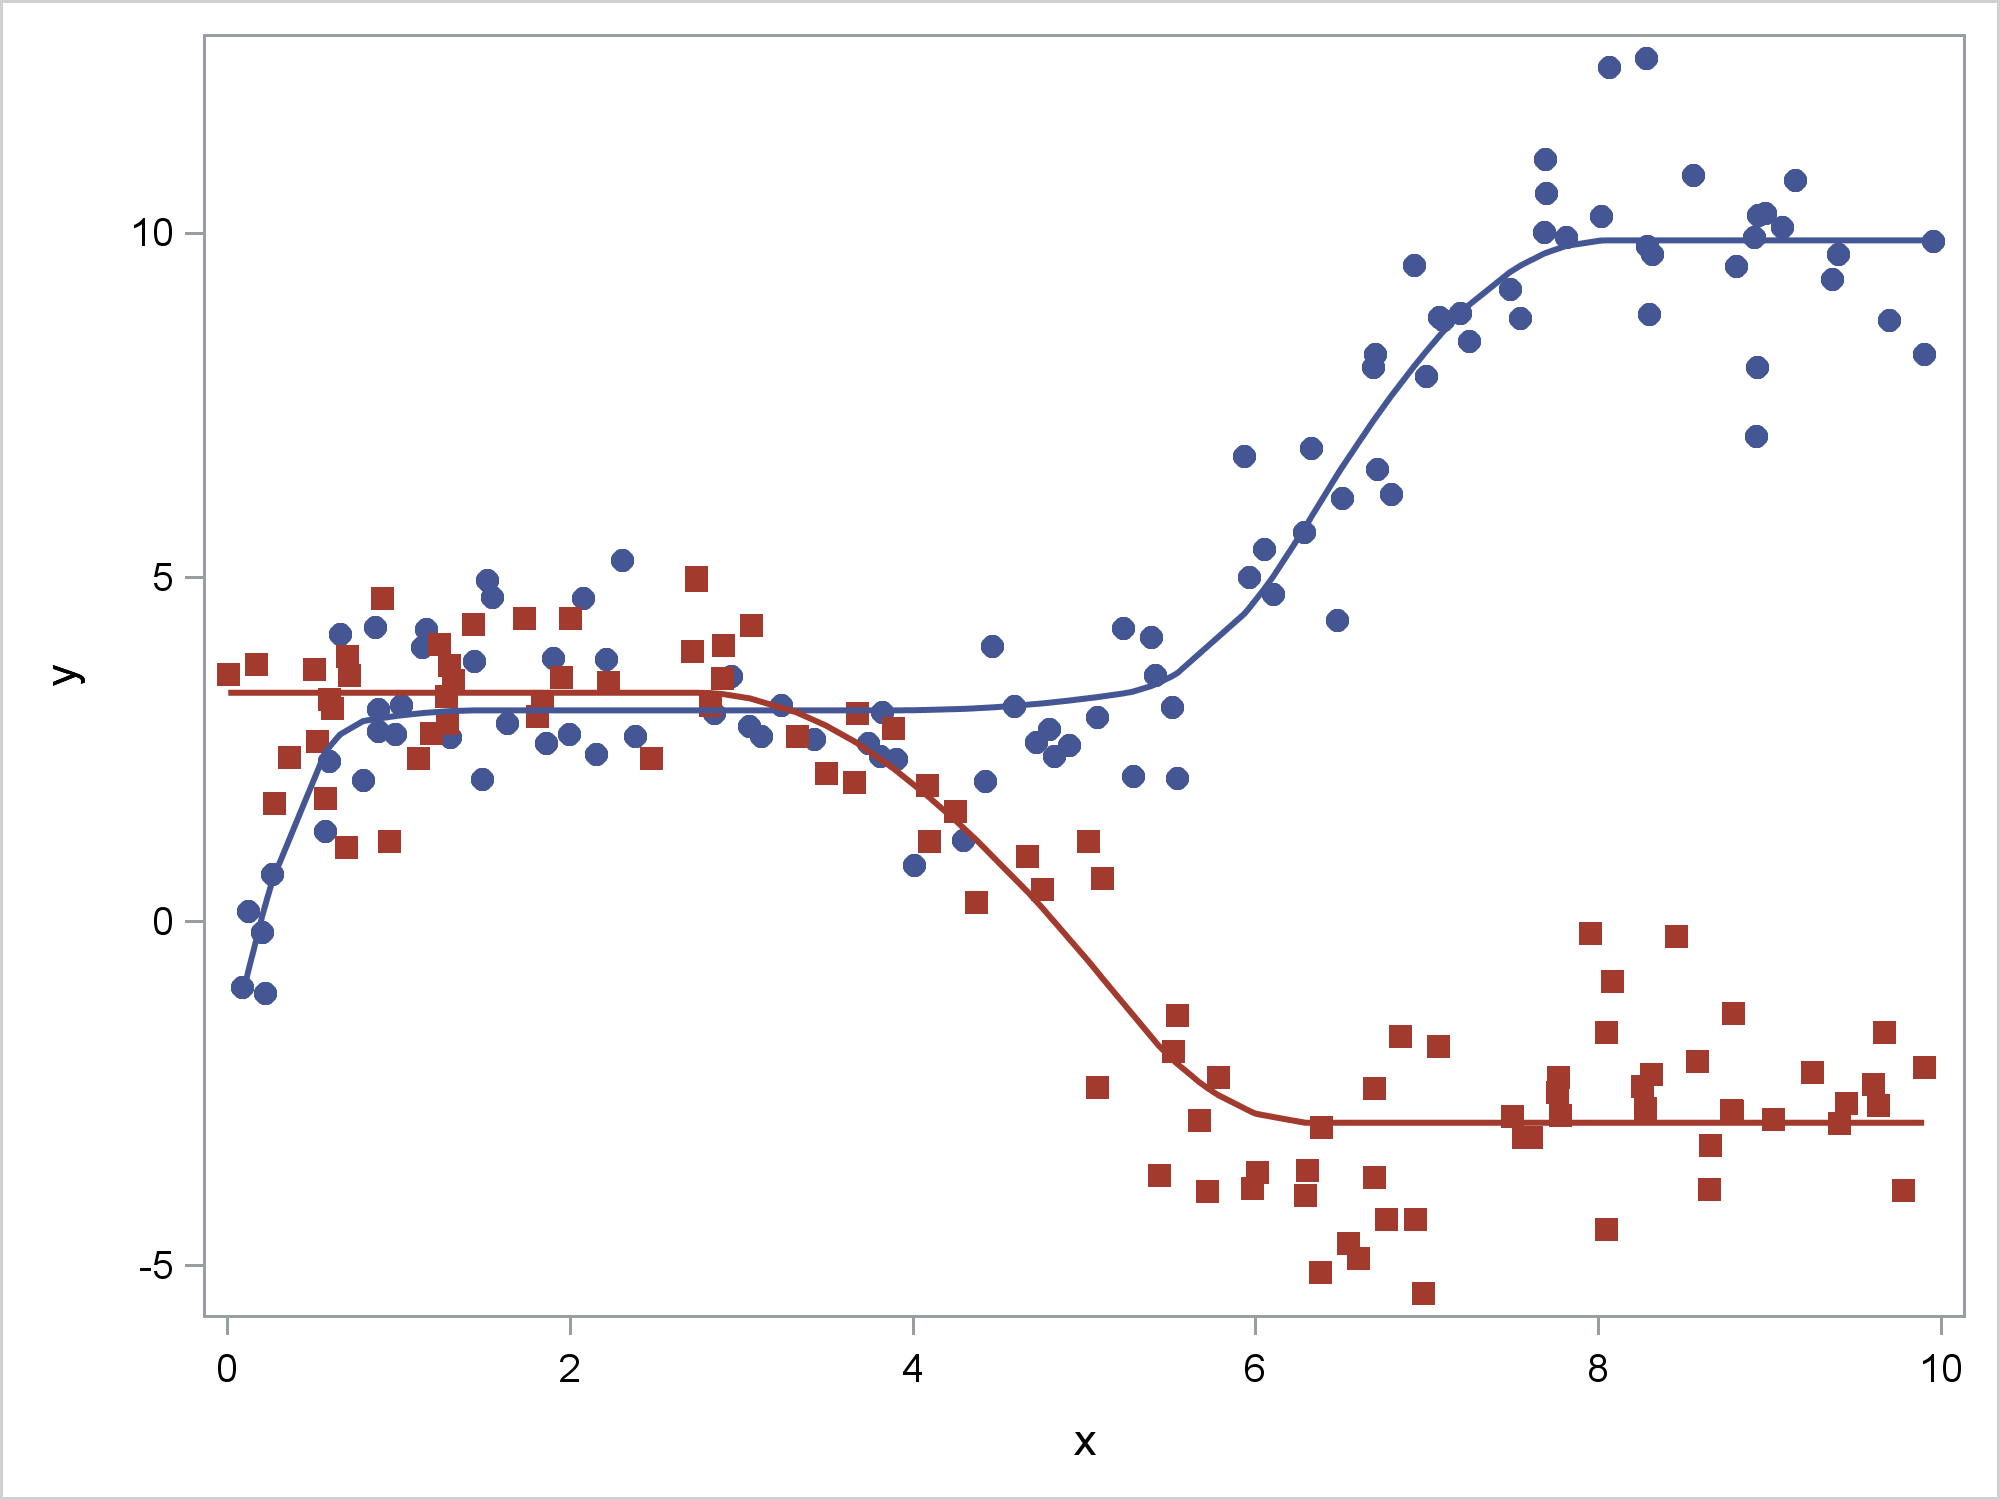
This post shows how to use PROC SGPLOT together with PROC TRANSREG to fit monotonically increasing or decreasing functions through a scatter plot.
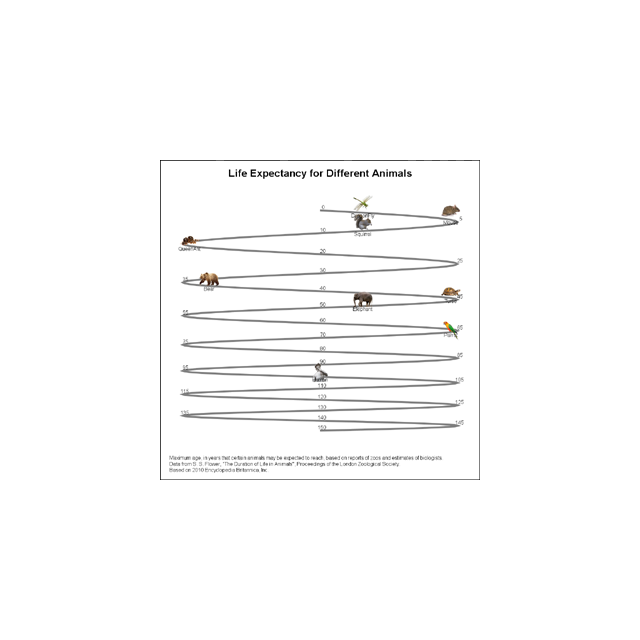
Last week I published an article on creating bar charts with visual category values. The idea was to use visual icons for the category values in a HBAR of age by animal. For the data, I referred to a visual from the 2010 Encyclopedia Britannica Inc. that I found on the
When ODS Graphics was first released with SAS 9.2 in 2008, a conscious effort was made to create graphs that were consistent and aesthetically pleasing out of the box. Features in the graph derive their visual attributes from the active Style. When Group classifications are in effect, the different classification
There has been much discussion on the SAS Communities page on usage of different symbols in a graph. The solutioin can vary based on the SAS release. New features have been added at SAS 9.4 releases to SG Procedures and GTL that make this very easy. With SAS 9.4M1, almost any combination is
Users have often expressed the need for more marker symbols. ODS Graphics supports over 30 scalable marker symbols, both filled and empty. As mentioned in an earlier article, with SAS 9.4, filled markers can now have outlines and fills, and can also have special effects. Also with SAS 9.4, now you
Last week, I presented some highlights of the new features for SG Procedures and GTL in SAS 9.4. Now, let us dig in a bit deeper. For a plot without a GROUP role, setting an attributes was always easy with SG procedures. All you need to do to set bar color