How to lie with a simulation

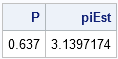
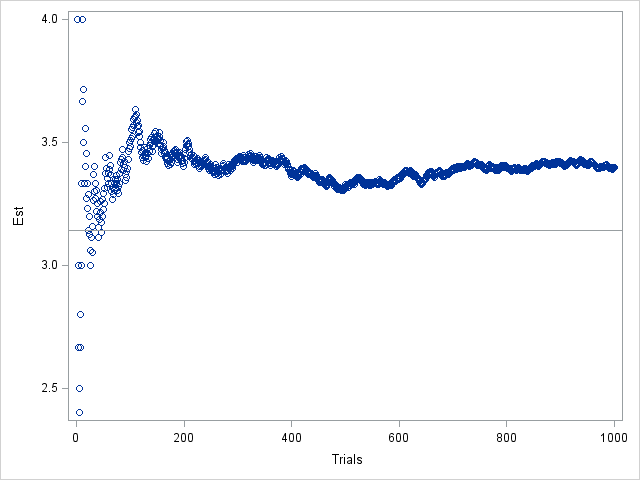
In my article on Buffon's needle experiment, I showed a graph that converges fairly nicely and regularly to the value π, which is the value that the simulation is trying to estimate. This graph is, indeed, a typical graph, as you can verify by running the simulation yourself. However, notice