Detecting outliers in SAS: Part 3: Multivariate location and scatter

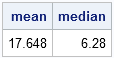
In two previous blog posts I worked through examples in the survey article, "Robust statistics for outlier detection," by Peter Rousseeuw and Mia Hubert. Robust estimates of location in a univariate setting are well-known, with the median statistic being the classical example. Robust estimates of scale are less well-known, with