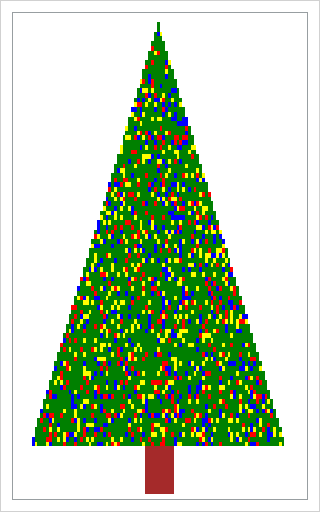
A Christmas tree matrix

O Christmas tree, O Christmas tree, Last year a fractal made thee! O Christmas tree, O Christmas tree, A heat map can display thee! O tree of green, adorned with lights! A trunk of brown, the rest is white. O Christmas tree, O Christmas tree, A heat map can display