Order variables by values of a statistic

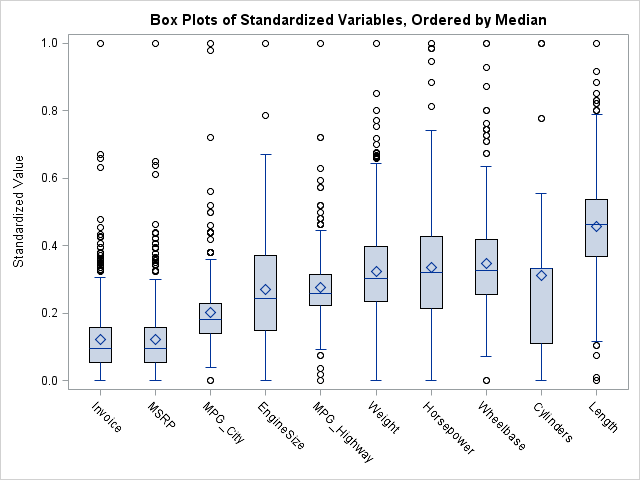
When I create a graph of data that contains a categorical variable, I rarely want to display the categories in alphabetical order. For example, the box plot to the left is a plot of 10 standardized variables where the variables are ordered by their median value. The ordering makes it