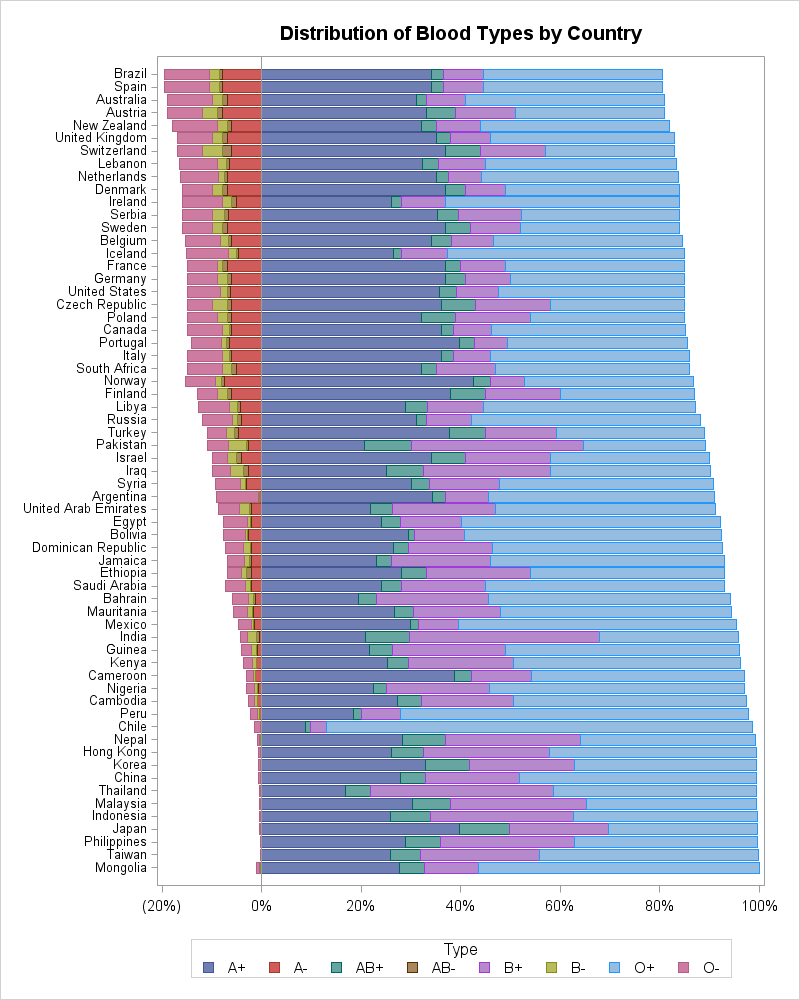
Tag: Statistical Graphics

Rick Wicklin 0
Create discrete heat maps in SAS/IML

In a previous article I introduced the HEATMAPCONT subroutine in SAS/IML 13.1, which makes it easy to visualize matrices by using heat maps with continuous color ramps. This article introduces a companion subroutine. The HEATMAPDISC subroutine, which also requires SAS/IML 13.1, is designed to visualize matrices that have a small

Rick Wicklin 0
Designing a quantile bin plot

While at JSM 2014 in Boston, a statistician asked me whether it was possible to create a "customized bin plot" in SAS. When I asked for more information, she told me that she has a large data set. She wants to visualize the data, but a scatter plot is not

1 77 78 79 80 81 102