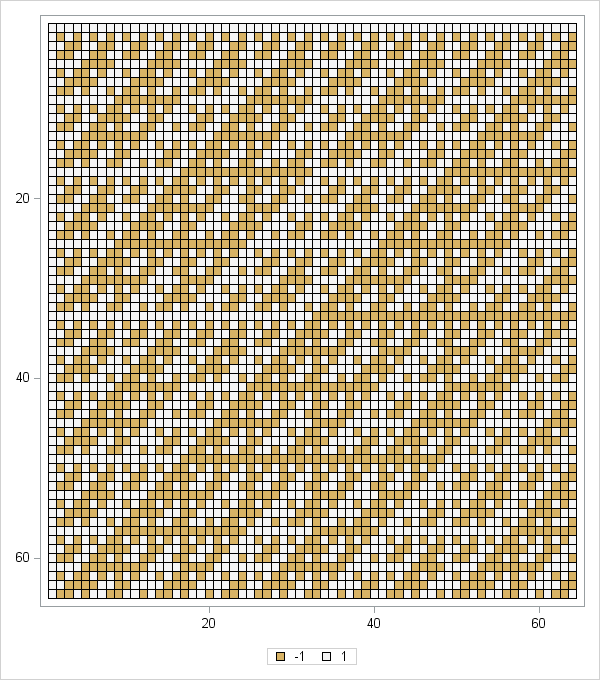
Tag: Statistical Graphics

Rick Wicklin 0
Designing a quantile bin plot

While at JSM 2014 in Boston, a statistician asked me whether it was possible to create a "customized bin plot" in SAS. When I asked for more information, she told me that she has a large data set. She wants to visualize the data, but a scatter plot is not

Rick Wicklin 0
Order variables by values of a statistic

When I create a graph of data that contains a categorical variable, I rarely want to display the categories in alphabetical order. For example, the box plot to the left is a plot of 10 standardized variables where the variables are ordered by their median value. The ordering makes it

1 79 80 81 82 83 104