Tag: Statistical Graphics

Rick Wicklin 0
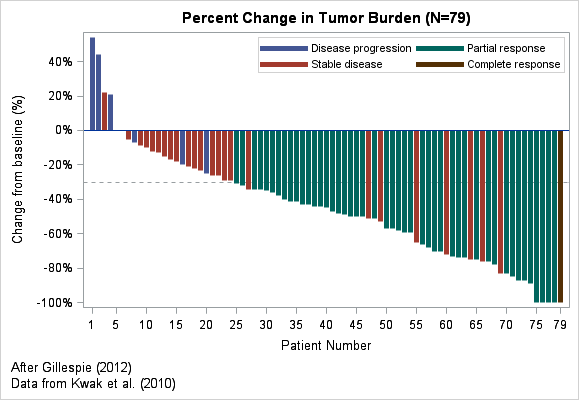
Create a waterfall plot in SAS

In clinical trials, a waterfall plot is often used to indicate how patients in the study responded to treatment. In oncology trials, the response variable might be the percent change in the size of a tumor from the individual's baseline value at the start of the trial. The percent change

Rick Wicklin 0
Visualizing the causes of airline crashes

There has been a spate of recent high-profile airline crashes (Malaysia Airlines, TransAsia Airways, Germanwings,...) so I was surprised when I saw a time series plot of the number of airline crashes by year, which indicates that the annual number of airline crashes has been decreasing since 1993. The data

1 75 76 77 78 79 103