Size matters: Preserving the aspect ratio of the data in ODS graphics

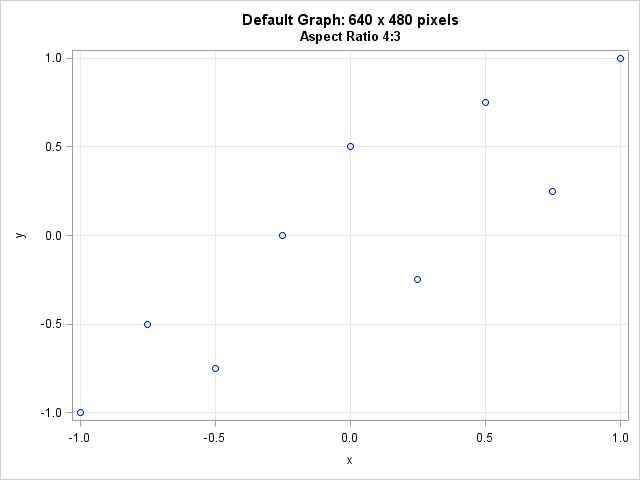
When creating a statistical graphic such as a line plot or a scatter plot, it is sometimes important to preserve the aspect ratio of the data. For example, if the ranges of the X and Y variables are equal, it can be useful to display the data in a square