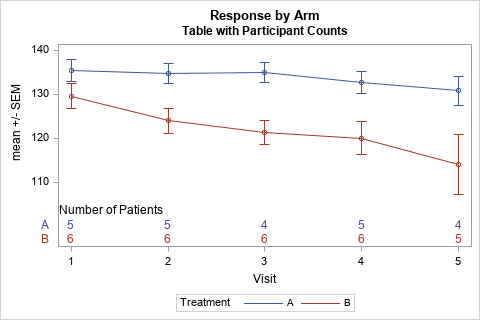
I often use axis tables in PROC SGPLOT in SAS to add a table of text to a graph so that the table values are aligned with the data. But axis tables are not the only way to display tabular data in a graph. You can also use the TEXT
The TEXT statement in PROC SGPLOT supports the ROTATE= option to rotate the specified text. It is worth knowing how the ROTATE= option interacts with the POSITION= option, which determines the anchor point at which the text is positioned. Briefly, the text is positioned FIRST, then the rotation occurs. The
A SAS programmer asked an intriguing question on the SAS Support Communities: Can you use SAS to create a graph that shows how the elements in a box-and-whiskers plot relate to the data? The SAS documentation has several examples that explain how to read a box plot. One of the