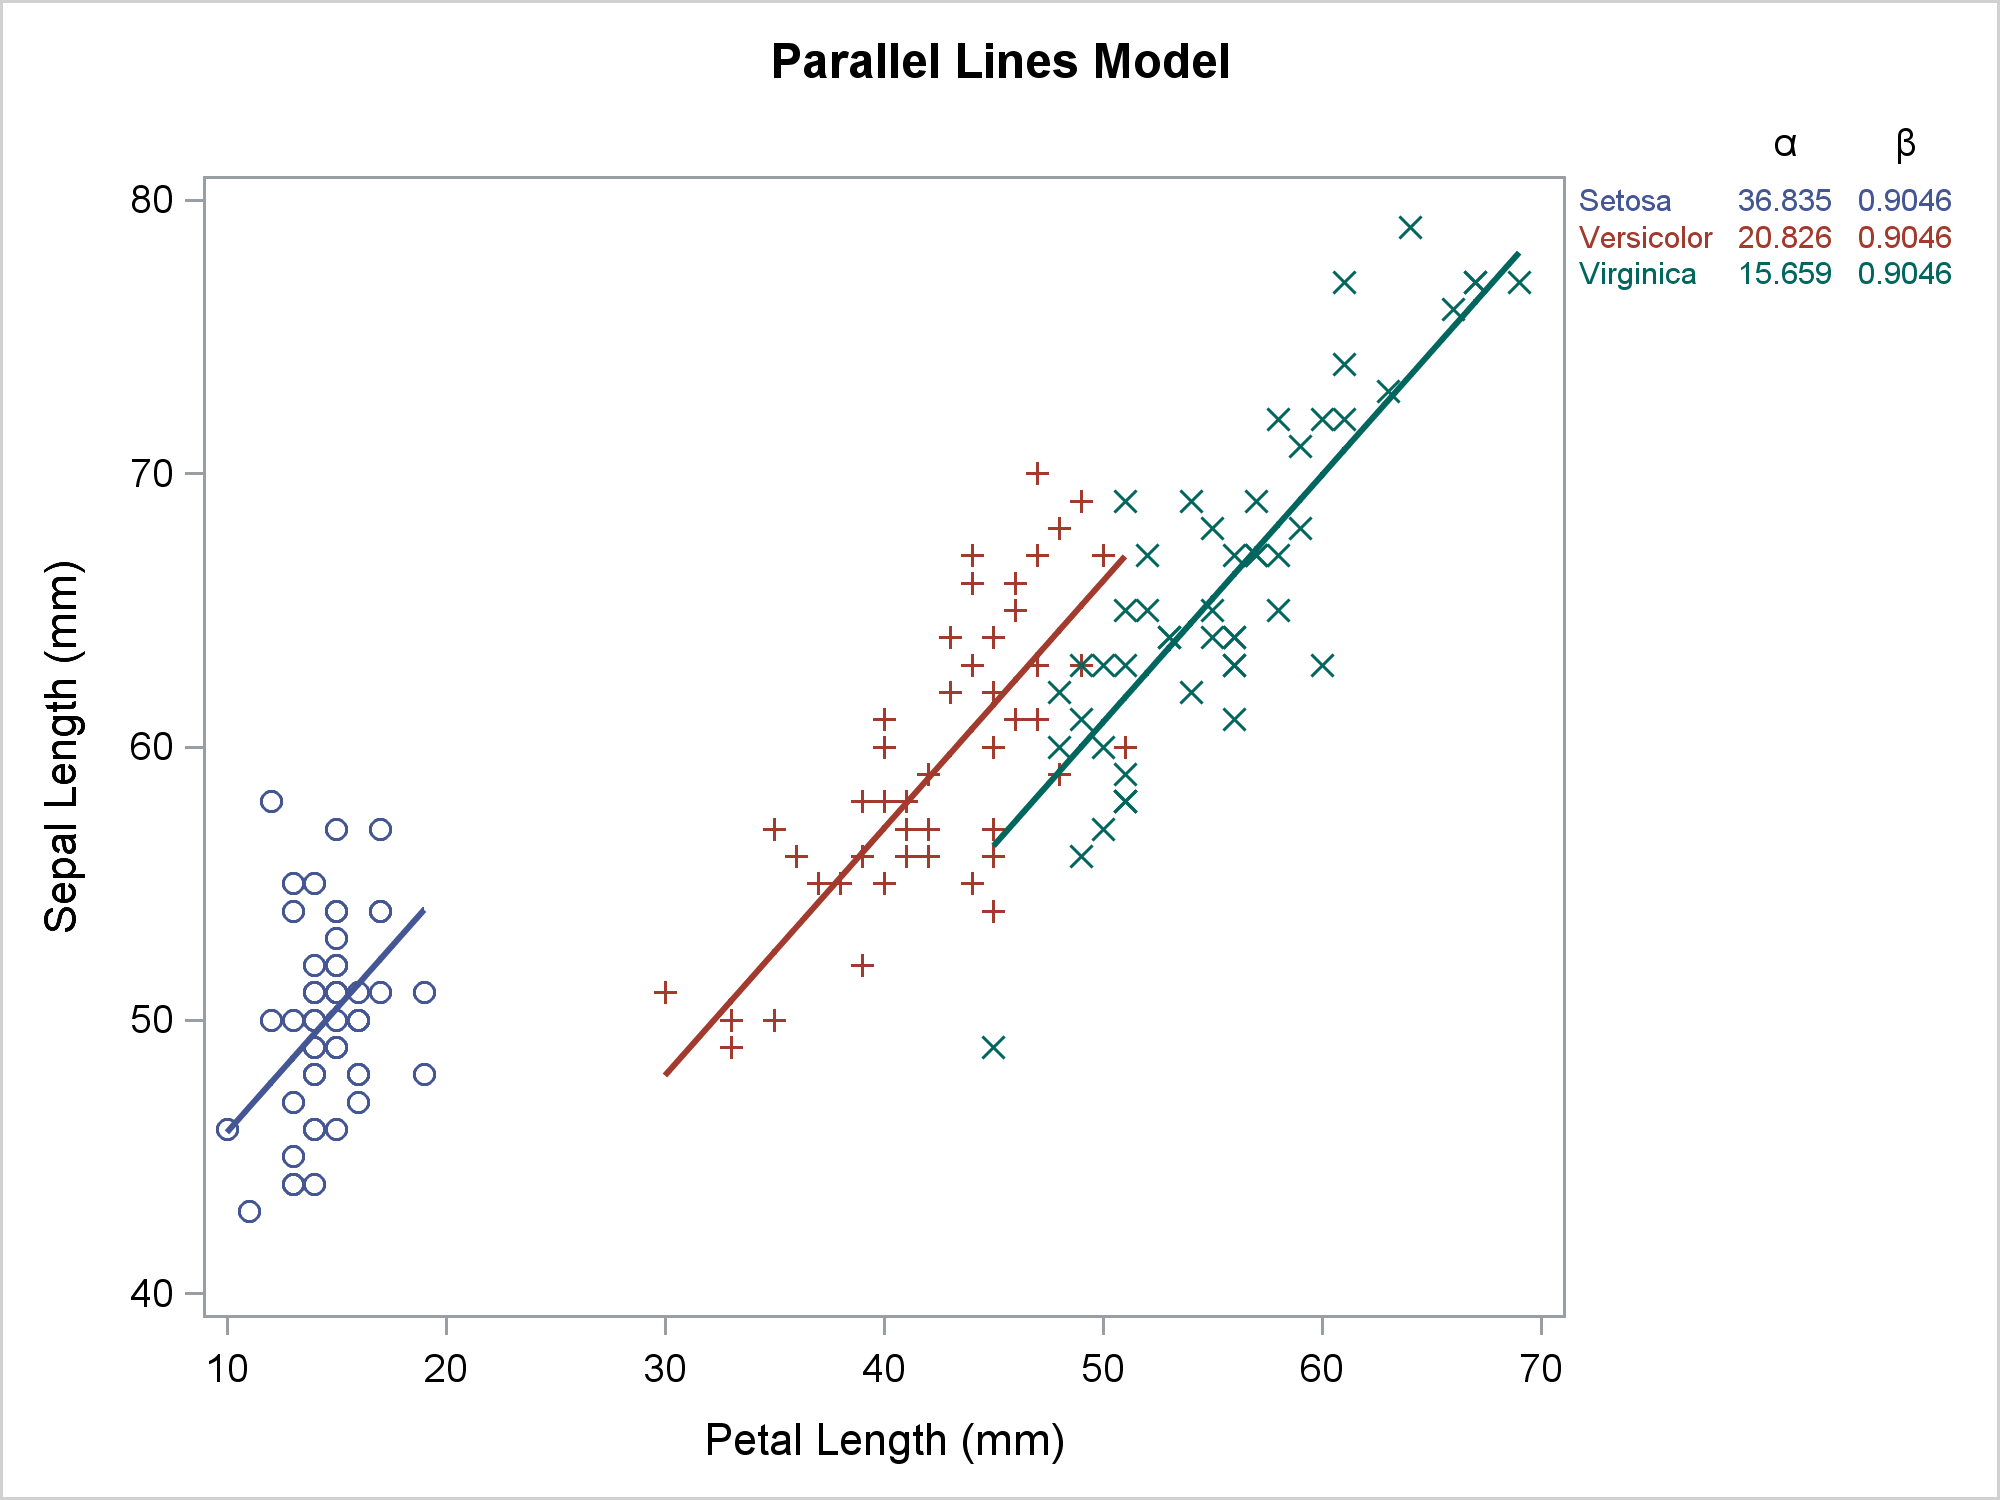
Usually, you use axis tables when there is a clear link between the rows of the axis table and the graph. I'll show how to use an axis table to create a table that is independent of the graph. This post also uses discrete attribute maps.
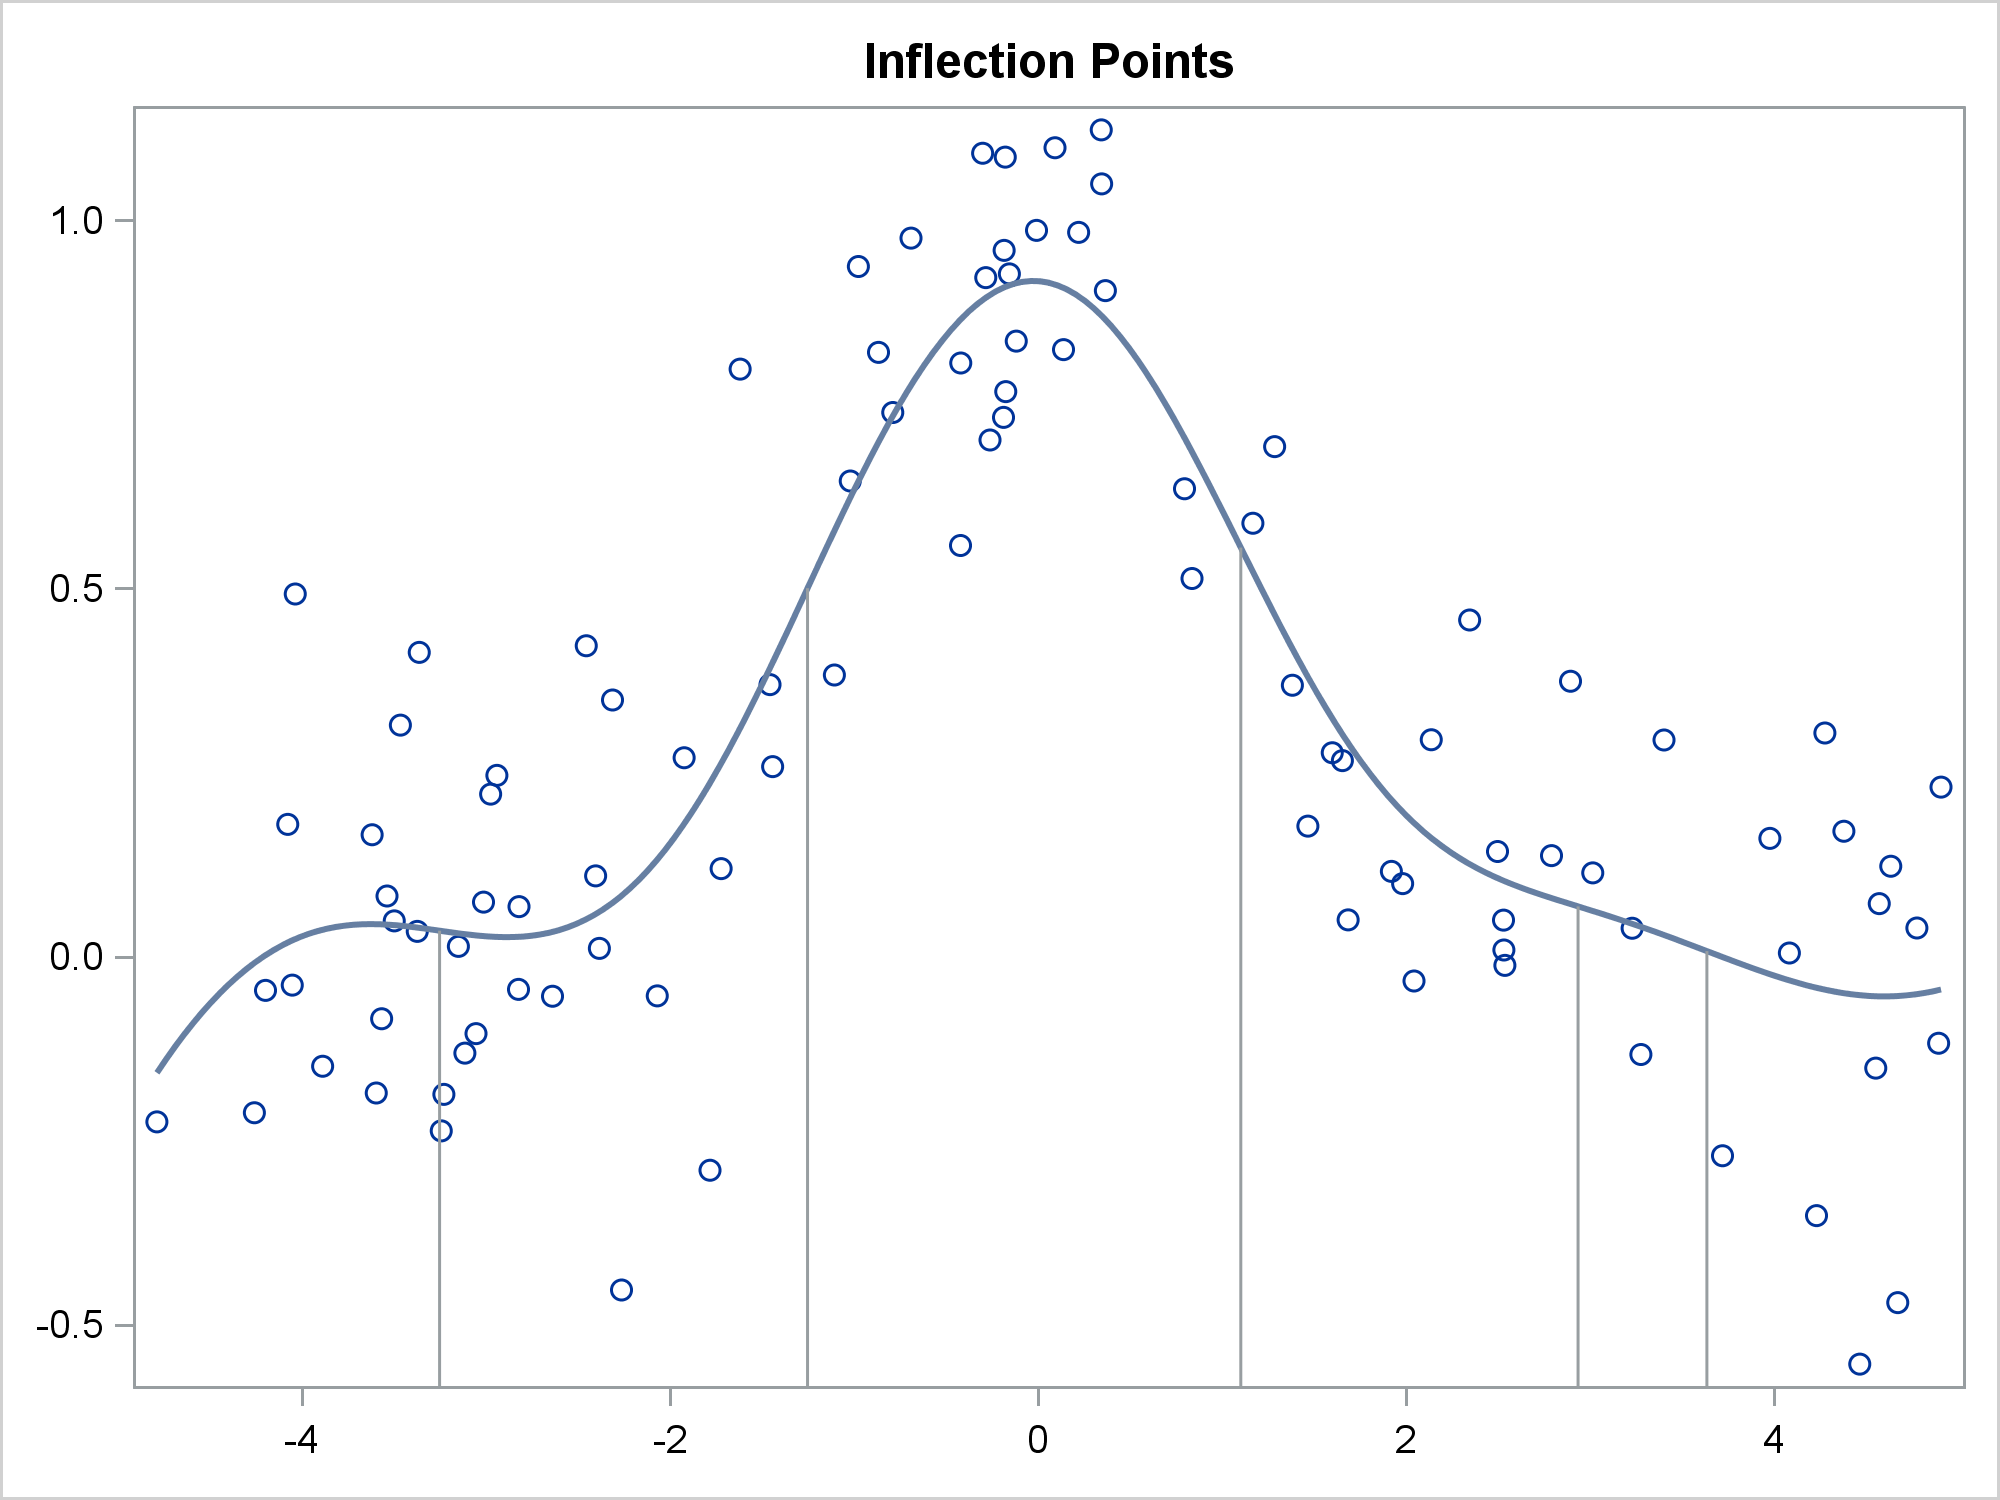
This post shows you how to run PROC SGPLOT, create smooth curves by using penalized B-splines, use ODS OUTPUT to create an output data set from PROC SGPLOT, and process it to display drop lines.
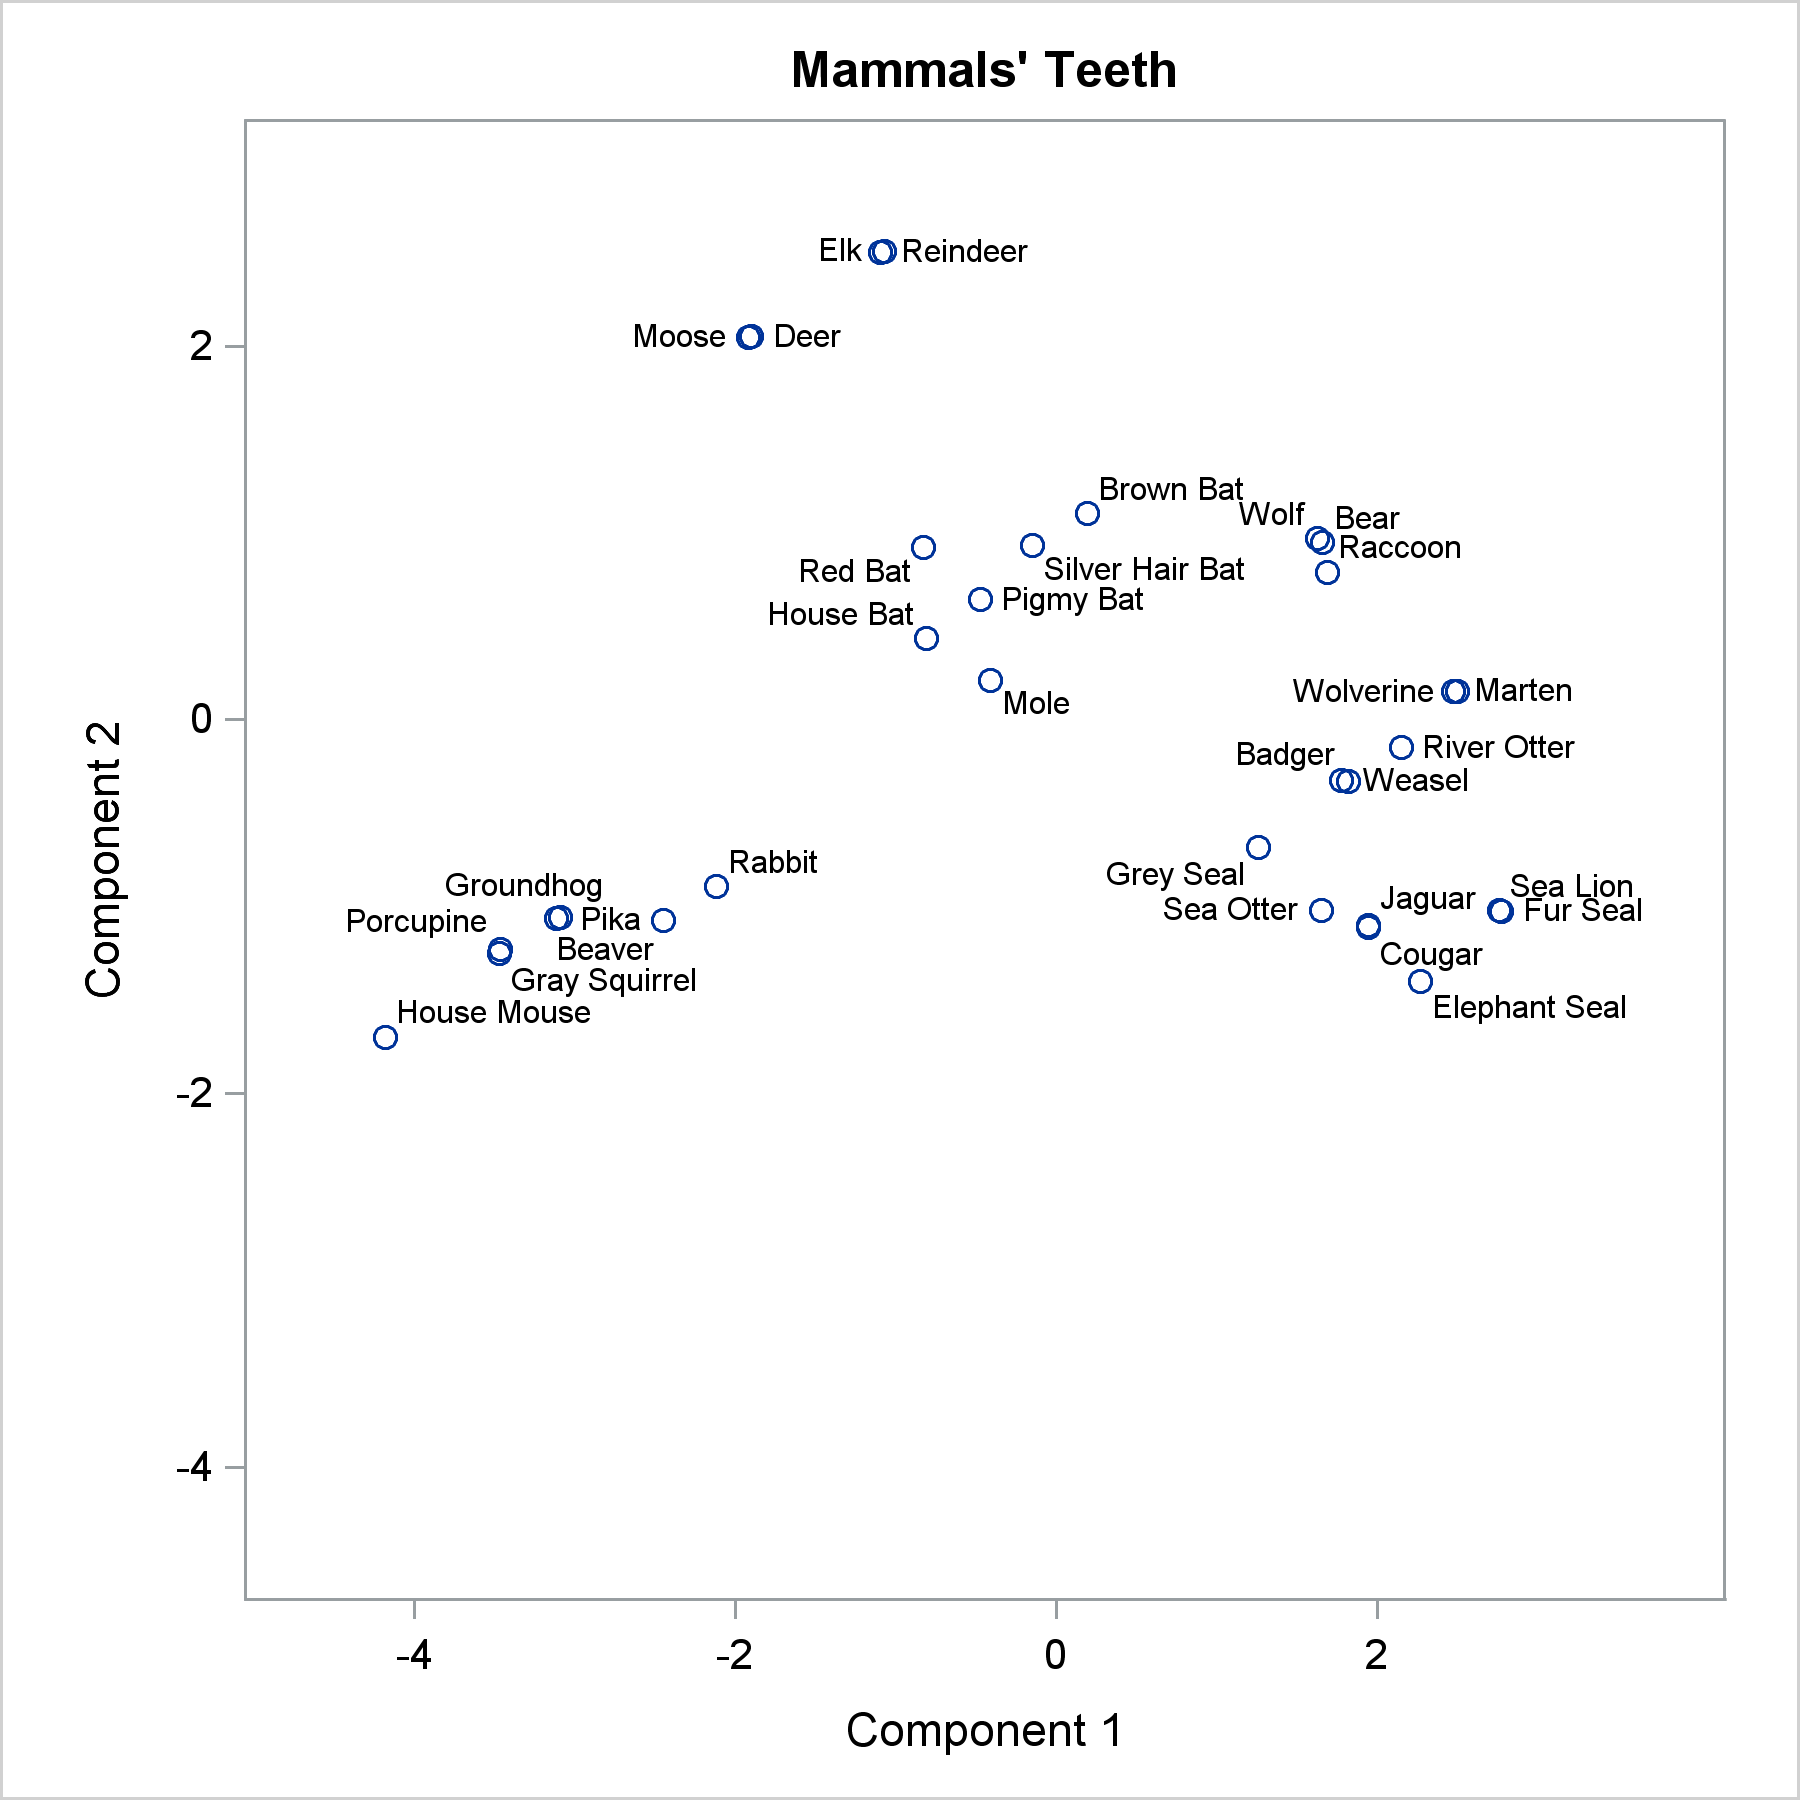
The POSITION= option in the TEXT statement provides you with a way to position text in a variety of locations relative to a point. You can use this option to fine tune label placement in a plot primarily created by using the SCATTER statement and the DATALABEL= option.