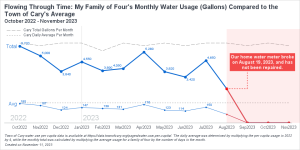
Have you ever been curious about your monthly water consumption and how it compares to others in your community? Recently, I had this question and decided to get ahold of my family's water usage data for analysis. Harnessing the power of data visualization, I compared my family of four's monthly
Tag: PROC SGPLOT
In my previous post, I described a new options to control the widths of the caps for Whiskers, Error and Limit bars. This topic could have been titled "Little things go a long way", as such details really make for a good graph. In a similar manner, another detail issue
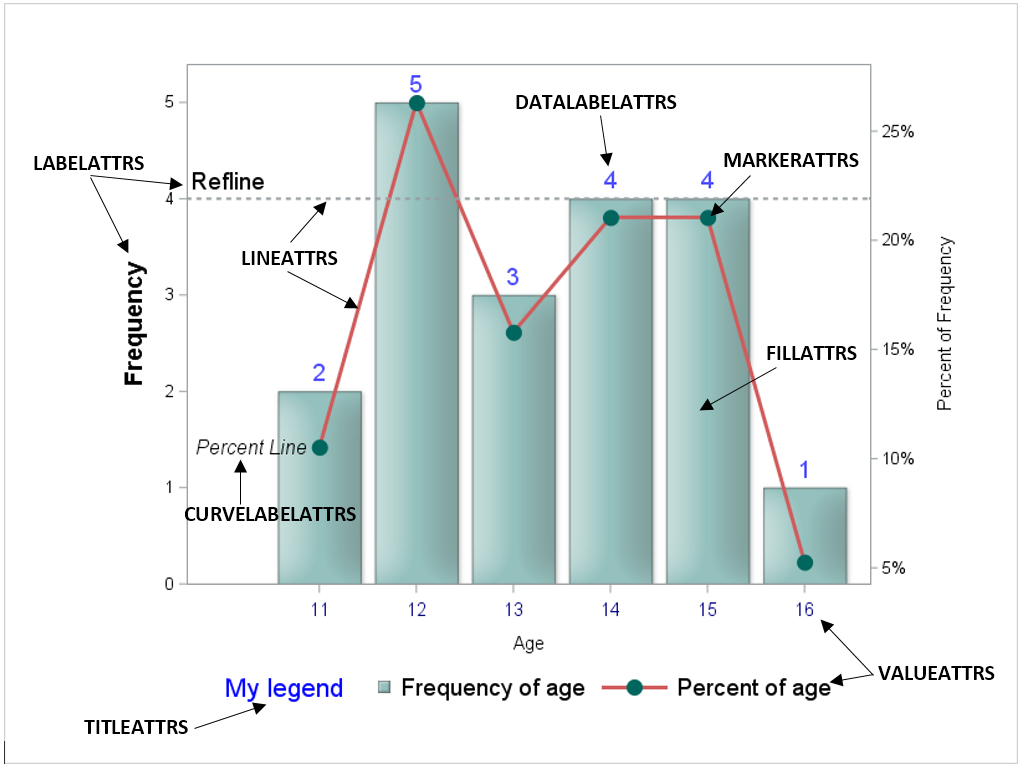
The SGPLOT procedure (as well as other ODS Graphics procedures) does a great job of creating nice- looking output with very little coding. However, there are times when you want to make adjustments to the output's appearance. For those occasions, we have an ATTRS for that! The statements in PROC
예술가들은 몇 가지 도구만으로도 멋진 그림을 그릴 수 있습니다. 물론, 물감, 색연필, 목탄 등 선호하는 도구는 저마다 다를 수 있겠지만 말이죠. SAS에서 멋진 그래프를 만드는 방법도 크게 다르지 않은데요, 오늘은 그 방법을 예를 들어 설명해보고자 합니다. SAS에서는 SAS/Graph Proc GMap을 사용하여 멋진 지도를 만들 수가 있습니다. GMap은 SAS가 지도 제작용으로 특별 개발한
In his recent blog article on Drawing Paths on a Map using SGPLOT, Robert Allison showed us visually the path computed by the captain of his return flight from Orlando. As usual, one can rely on Robert to put in visual form some interesting bit of information. Thanks, Robert. I
SAS Global Forum 2017 is around the corner and SAS users are gearing up to travel to Orlando for a blockbuster conference. ODS Graphics is now a well known component of Base SAS and many readers of this blog who are proficient users of SG Procedures and GTL can look
Back in 2013, I wrote a paper for the SAS Global Forum, reviewing the attributes that go towards making a good graph. In this paper, I covered many recommendations from industry thought leaders that can help enhance the effectiveness of graphs to deliver the intended information. One of the aspects that
Often I have written articles that are motivated by some question by a user on how to create a particular graph, or how to work around some shortcoming in the feature set to create the graph you need. This time, I got a question about Clinical Graphs that were mostly working
A coworker was recently in need of some simple graphics to include in a slide show to accompany her SAS Global Forum paper. After listening to what she wanted, I decided that I could use PROC SGPLOT to create those images for her. The first image was a set of stacked
Many users of ODS Graphics will be excited to learn that, beginning with SAS® 9.4 TS1M3, SG procedures are able to recognize formatted values that contain Unicode values. One benefit of this is that it allows you to include, without using annotation, special symbols such as greater-than-or-equal-to signs or Greek
The topic of cluster groups comes up often. By cluster group I am referring to the feature in bar charts where the group values are displayed side by side. With SAS 9.3, SG Procedures support stack or cluster grouping for Bar Charts and overlay or cluster grouping for all other